Taking an export from my HP Tuners datalog, I have been doing a bit more data analysis of various parameters.
Perhaps I am doing something wrong, but there appears to be a ‘hiccup’ in the csv export of the HP Tuners, in that the RPM is exported to the comma delimited file with a comma-formatted value. For example, 2450 rpm is exported as 2,450 rpm so when imported as a comma delimited value it gets split into 2 and 450. So, once I manually fixed that in my target file then I could import the data and begin to make some charts.
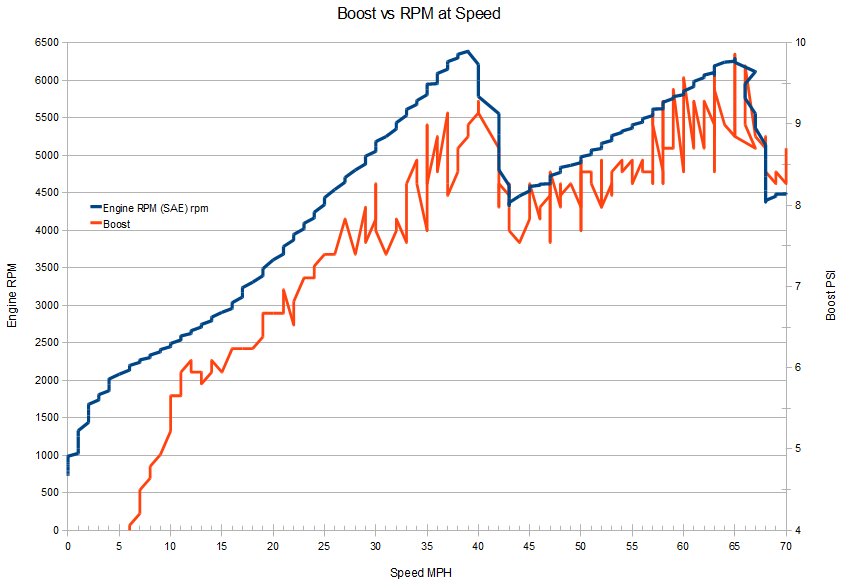
These charts show RPM across speed 0-60 mph, along with Boost at the same speeds.
RPM is shown on the left Y axis, and Boost PSI on the right Y axis. Speed in MPH is along the X axis.
Boost is certainly spikey measured this way. There may also be other factors involved.
The Boost PSI is calculated by comparing the Manifold Absolute Pressure (MAP) with the V’s Barometric calculation (Baro). One can see that the V does not shift at exactly the same RPM at 1-2 and at 2-3 although I believe they are both specified to shift at 6500 RPM.
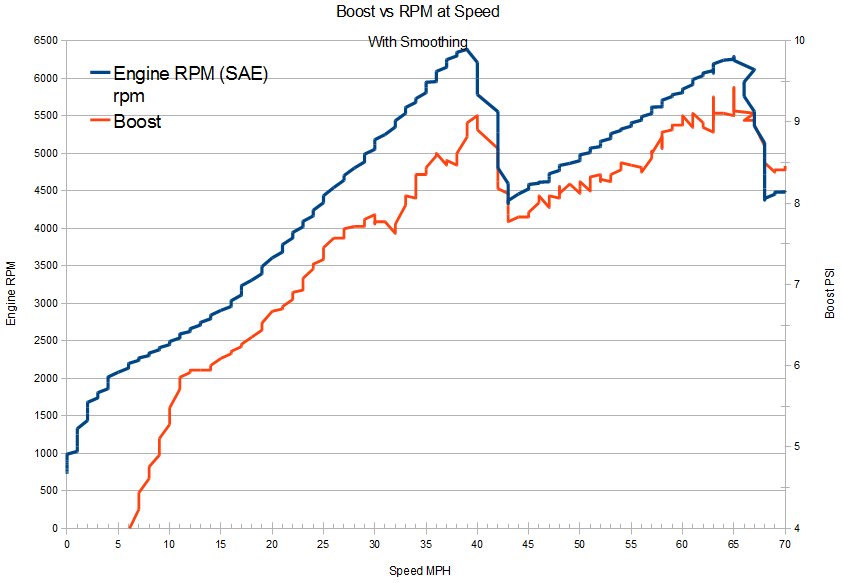
This is the same graph with some smoothing done by averaging of values, 2 prior to and 2 after each point.
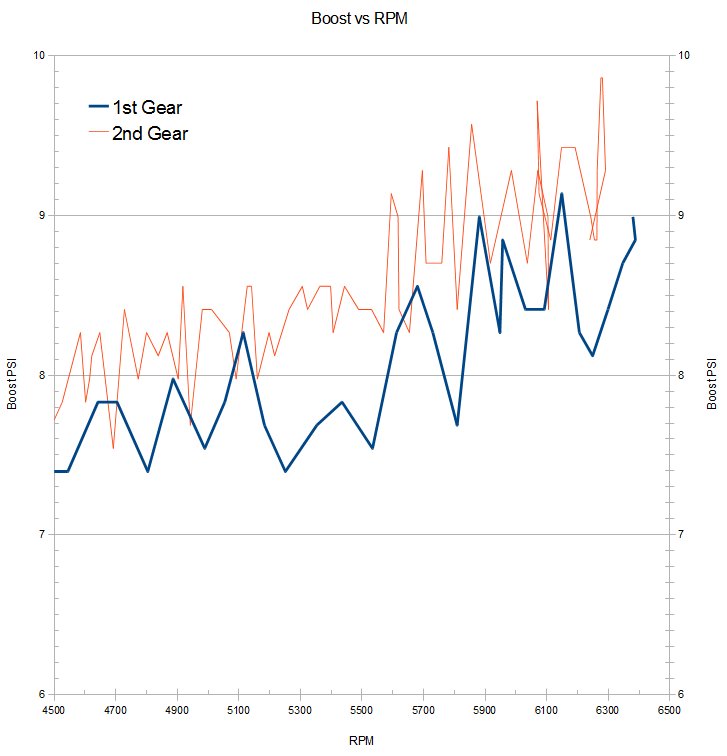
Finally, here is a graph showing boost in the target range of 4500 RPM to 6500 RPM with boost in 1st gear shown in blue and boost in 2nd gear shown in red:
Summary
My conclusion is that boost is in fact higher in 2nd gear than 1st gear. This is perhaps due to more air flow into the intake at speed? I am not certain.
On the graph Boost appears to settle around 9 PSI at high RPMs. Boost in this dataset peaks at 9.86 PSI which in the smoothed set is 9.43 PSI. The STS-V was designed for 12 PSI of boost. If we assume the supercharger makes 12 PSI of boost then this reading after the Laminova tube intercooler suggests that the pressure drop of air across the intercooler is 2.57-2.14 PSI.

