Cadillac Northstar LH2 4.6L V8 VVT Tuning #hptuners #Motorama

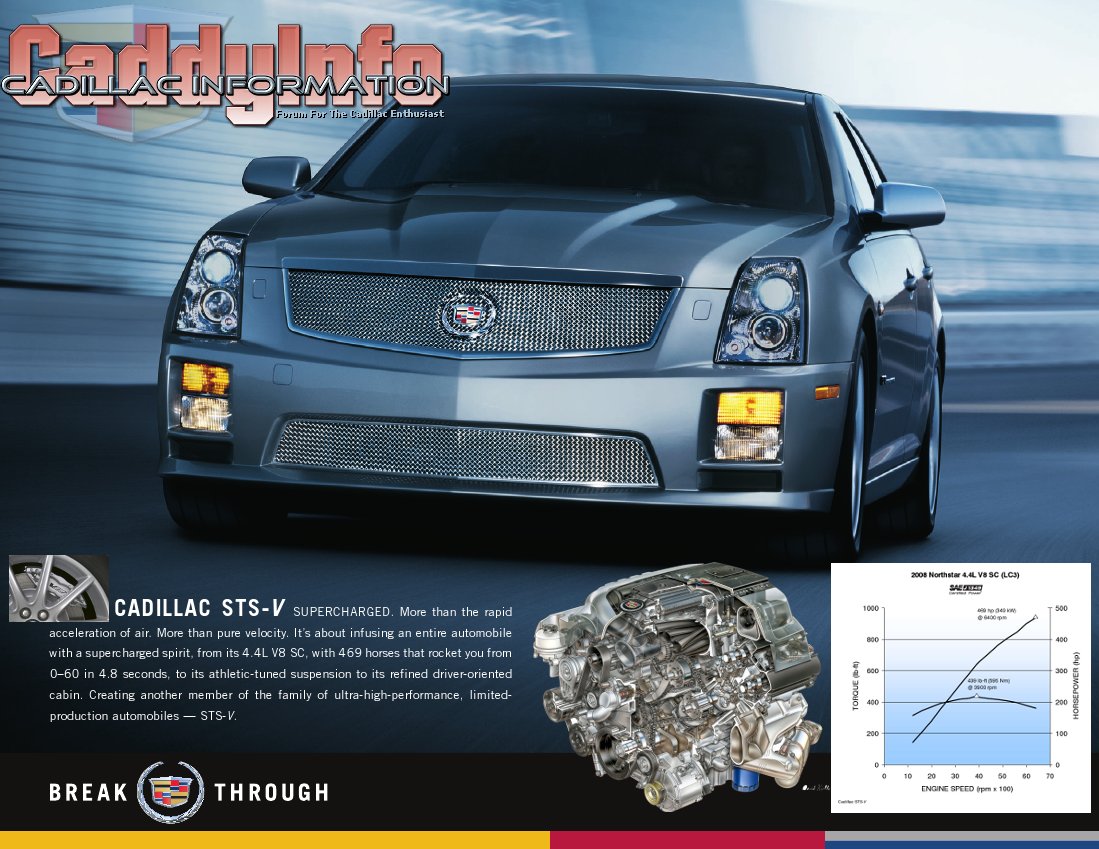
The LH2 V8 added variable valve timing (VVT) based on the Premium V6 schema of the same time.  Interestingly, the LH2 and the LC3 use the same base cam timing, which reinforces how much the LC3 Supercharged V8 in my STS-V is a supercharged 4.4L LH2.  It may also give us some insights into how the LH2 VVT is programmed vs the LC3 VVT.

Here in Plano, Texas we stay in the High BARO table, so we’ll be looking there.  The same principles should apply in other barometer ranges.

Here is the OEM calibration for the intake and exhaust cams at high baro.  During WOT my LH2 operated around .57 g/cyl airmass so I have blue-lighted the .56-.60 areas: [click to zoom in, back to return]

lh2 vvt intake and exhaust cams

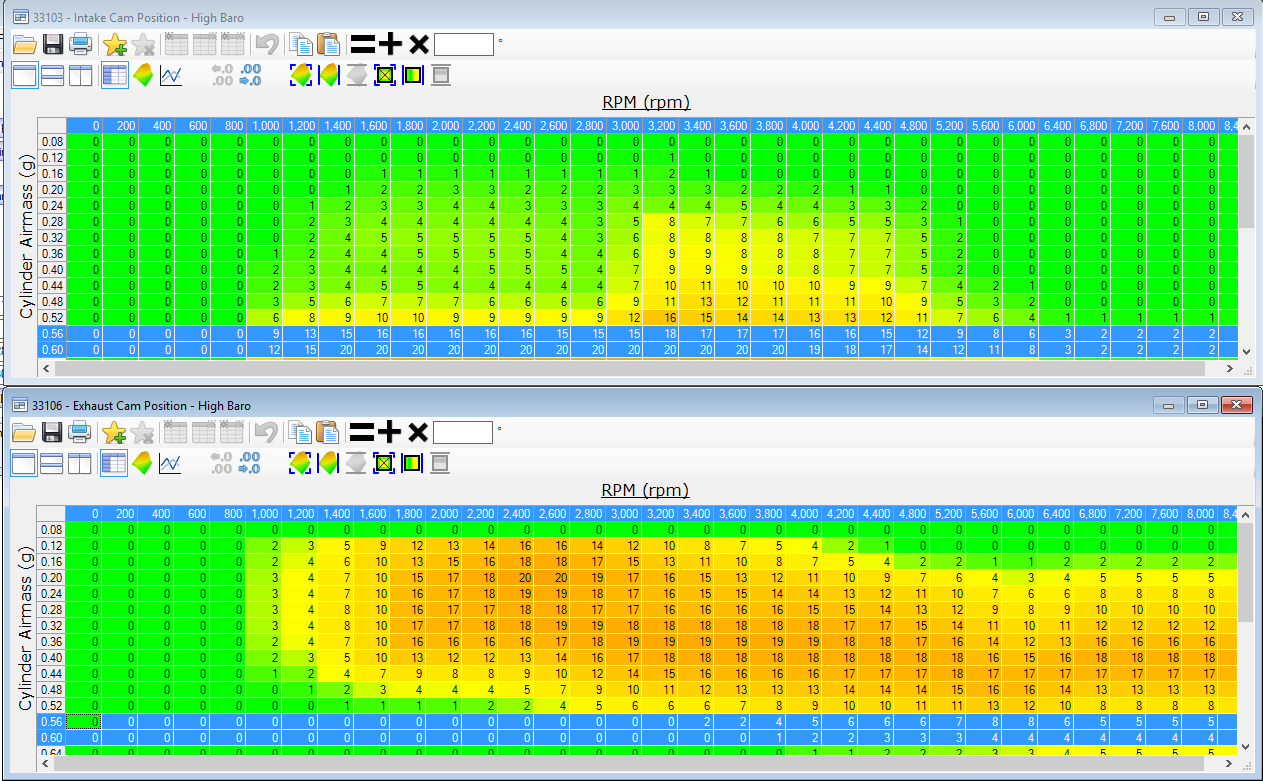
What we see is that the intake cam goes from 16-19 degrees at 4400 rpm down to 2 degrees at 6800 rpm.  The exhaust cam goes from 3-6 degrees at 4400 rpm to 4-5 degrees at 6800 rpm.

The values for the intake cam should be degrees of advance, and the values for the exhaust cam degrees of retard.   For the LH2 it appears 0 degrees of either are Top Dead Center (TDC) [ref: Helms manual pg 9-340].   If that is the case, as the engine moves to high RPM the intake cam gets less advanced (retards), and the exhaust cam gets more retard (retards).

camactuatoroperation

Simple cam tuning rules for Naturally Aspirated engines like my LH2: [ref]

  • Advancing both cams => more low-RPM power, less high-RPM power
  • Retarding both cams => more high-RPM power, less low-RPM power
  • Less overlap => more low-RPM power, less high-RPM power
  • More overlap => more high-RPM power, less low-RPM power

So as the engine moves to higher RPM we want to see both cams retarding, and that is what we appear to see.  We would also like to see more overlap, and that is not what we see — the net change between the two cams appears to introduce more overlap not less.

I am interested in the changes over cylinder air mass within the table.  At lower cylinder airmass the changes have the same basic shape, but to different degrees.

LH2 Intake Cam Graph

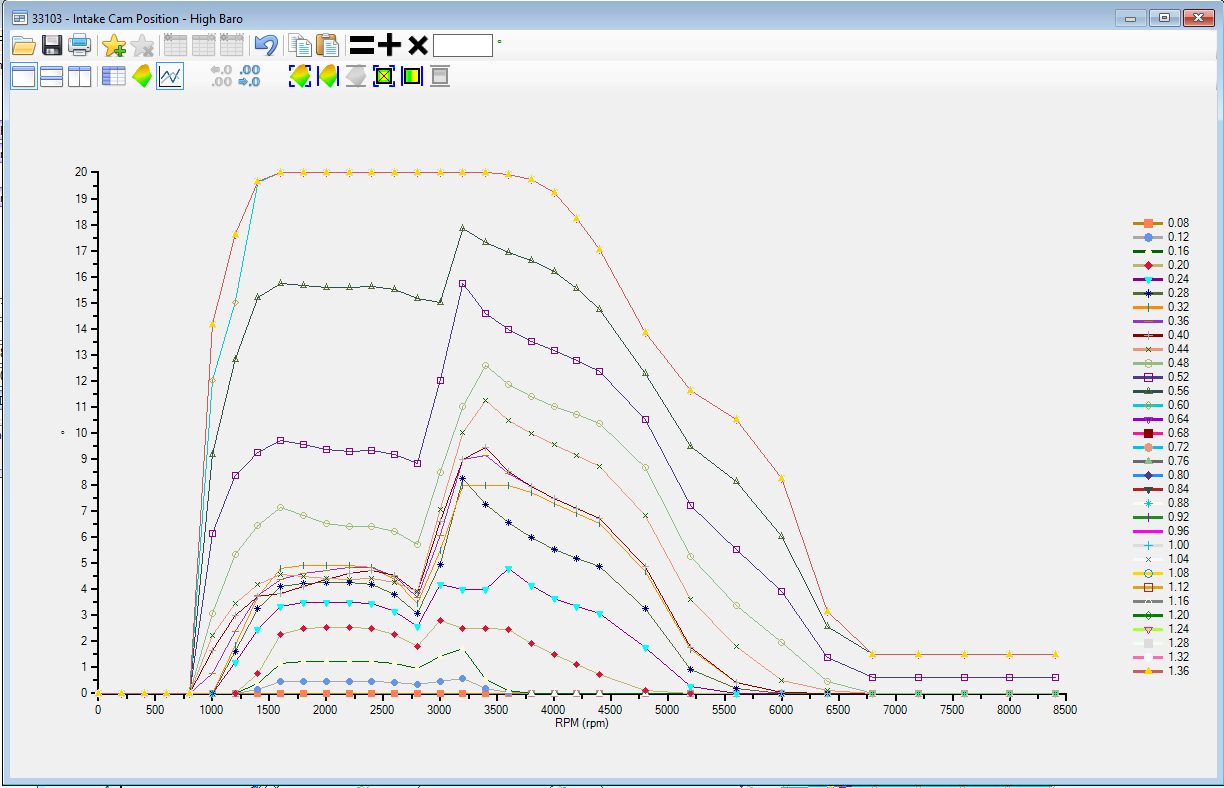
This graph shows the degrees of intake cam (left axis) vs rpm (bottom axis) at various gram/cyl air pressures.  The top two lines are our lines of interest, which seems odd, but because the graph maxes out at that point every other range over-writes the top line.

I think our first step will be to begin logging the intake and exhaust cam positions in order to verify that there are not other tables having an impact on these values.

What do you see in the data?  How would you tune these values for low-end torque and high end power?

HPTuners, Delivered torque, Virtual Dyno, SC losses

I have been quoting delivered HP values in recent articles, and these are quick and easy to ref.  This is a PCM calculated value that converts air flow to torque using air/fuel ratio and spark advance.
In an article here http://caddyinfo.com/wordpress/wheel-hp-calcualted-hp-and-you/ I showed a comparison of calculated hp for my STS-V vs Virtual Dyno results.

  
In that analysis I found there were 26% losses from calc hp to virtual dyno.  My current theory is that delivered hp does not account for supercharger losses, or the hp to turn the supercharger.   Further, With est transmission losses at 20%, that analysis shows supercharger turning loss to be ~6%, or as accurately can be modelled as 40 hp.  [also possible it does include sc turning losses, and delta is greater losses due to 1 or 2nd gear not 1:1]

I continue to find Calc HP to be useful and quick to reference, for comparison a 6% loss must be considered as well – so a comparable engine dyno after S/C pumping loss would be 6% less.  If the calc hp was 522, adjusted for conditions = 556, after s/c 522 crank hp, dyno-equivalent after 20% trans loss would be .8 x 522 = 417 wheel hp or whp.  I think that is the factor I was missing previously, and will save some analysis somersaults.  While delivered torque gets a lot of poor press on the web, the shape of the curve and values do validate against the virtual dyno analysis of the same data and the dynojet tests I have done.

What do you think?

Quick STS-V tune check-in

Cadillac_STS-V Composite

Grabbed my gear and ran a quick scan on the STS-V to see how it is doing 2 years later.  Odd divot in the pull but could have been situational in the way I did the test; I don’t see an obvious cause in the data.

sts-v quickblast 2015-08-18

Here is a snapshot of the HPTuner screen at max hp (522).  Gotta love a supercharged V8.

stsv 2015 scan1

I will re-run later in the week to see if divot is an anomaly or something to address.  I didn’t realize the divot was there until I reviewed the data to post.  The engine pulls 12 degrees of advance there — perhaps the traction control kicked in?

I was watching during the drive to see how the IAT2 responded, to tell me if the pump was running, coolant circulating, etc for the intercooler.  That seems to be the case.  The STS-V was heatsoaked, it was hot here (100F), IAT1 just starting the test at 120F, and IAT2s at 154F.  Hot, hot, hot.  

  
The correction factor for environmental conditions the car saw was 1.065, so still around 522.5 x 1.065 = 556 corrected hp similar to 2013 tests.