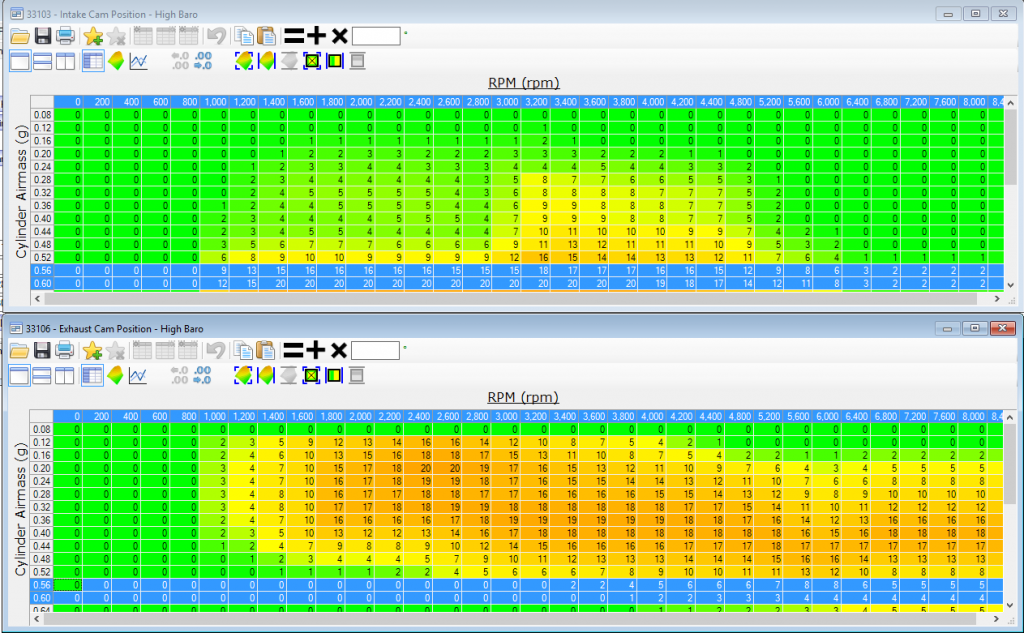
The LH2 V8 added variable valve timing (VVT) based on the Premium V6 schema of the same time. Interestingly, the LH2 and the LC3 use the same base cam timing, which reinforces how much the LC3 Supercharged V8 in my STS-V is a supercharged 4.4L LH2. It may also give us some insights into how the LH2 VVT is programmed vs the LC3 VVT.
Here in Plano, Texas we stay in the High BARO table, so we’ll be looking there. The same principles should apply in other barometer ranges.
Here is the OEM calibration for the intake and exhaust cams at high baro. During WOT my LH2 operated around .57 g/cyl airmass so I have blue-lighted the .56-.60 areas: [click to zoom in, back to return]
What we see is that the intake cam goes from 16-19 degrees at 4400 rpm down to 2 degrees at 6800 rpm. The exhaust cam goes from 3-6 degrees at 4400 rpm to 4-5 degrees at 6800 rpm.
The values for the intake cam should be degrees of advance, and the values for the exhaust cam degrees of retard. For the LH2 it appears 0 degrees of either are Top Dead Center (TDC) [ref: Helms manual pg 9-340]. If that is the case, as the engine moves to high RPM the intake cam gets less advanced (retards), and the exhaust cam gets more retard (retards).
Simple cam tuning rules for Naturally Aspirated engines like my LH2: [ref]
- Advancing both cams => more low-RPM power, less high-RPM power
- Retarding both cams => more high-RPM power, less low-RPM power
- Less overlap => more low-RPM power, less high-RPM power
- More overlap => more high-RPM power, less low-RPM power
So as the engine moves to higher RPM we want to see both cams retarding, and that is what we appear to see. We would also like to see more overlap, and that is not what we see — the net change between the two cams appears to introduce more overlap not less.
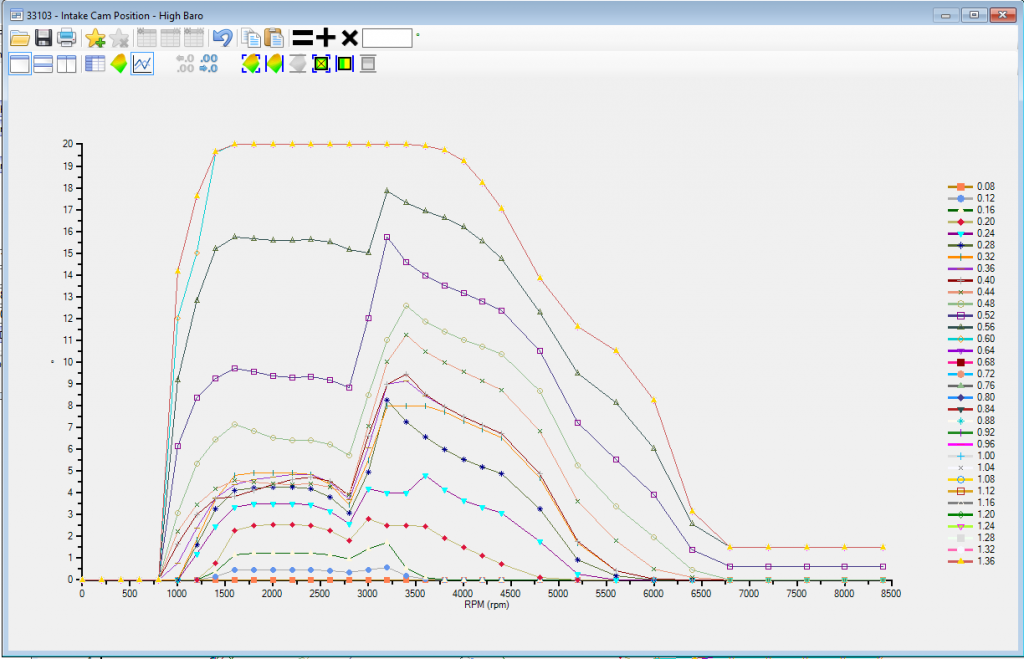
I am interested in the changes over cylinder air mass within the table. At lower cylinder airmass the changes have the same basic shape, but to different degrees.
This graph shows the degrees of intake cam (left axis) vs rpm (bottom axis) at various gram/cyl air pressures. The top two lines are our lines of interest, which seems odd, but because the graph maxes out at that point every other range over-writes the top line.
I think our first step will be to begin logging the intake and exhaust cam positions in order to verify that there are not other tables having an impact on these values.
What do you see in the data? How would you tune these values for low-end torque and high end power?


