ATS-V LF4 Boost and Baro

I have been thinking about boost and barometric pressure, as what I see in the scans confuses me. Complicating the issue is source of the signal, meaning there are multiple sources of related information, and the poll rate or how often that source updates.

Basic Issue snapshot:

At a specific scan snapshot I see this:

Boost Math 17.7 — this is a parameter in hptuners math that takes MAP minus Baro
Boost / Vacuum 18.7 psi — this is a sensor that compares total boost to vacuum (baro)
Absolute boost (not referenced to baro) 32.7 psi
MAP 31.6 psi
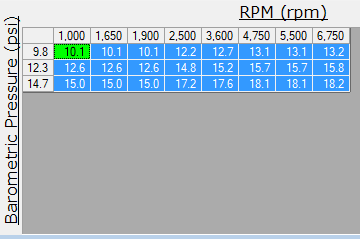
Baro (SAE) 13.49 psi
Baro (mfr) 14.43 psi
Baro (SAE) chart update 13.69 psi

First, let me say I love the detail that we can see in the scanner.

I do get how each of these numbers should relate — for example, absolute boost minus barometer should be what Boost/Vacuum is; that’s the definition. But the math does not quite work. There are 3 baro readings, and they differ slightly, so there’s that. But none of them fit perfectly. There are 2 total boost readings, MAP and Boost Total, so there’s that, but neither of them fit perfectly with any of the 3 baro readings to result in the parameters shown.

Example: Abs Boost – Baro (sae) = 32.7 – 13.49 = 19.21 psi

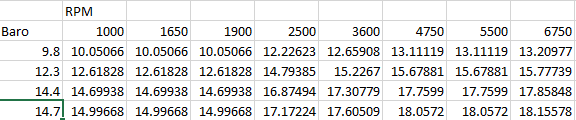
2348 Boost Math says it uses 50032, the Generic Sensor for Baro, and 50030 the MAP.
Boost Math scans at 17.84 psi. 50032 Baro reads 14.06 psi in that instant. The MAP reads 31.90 in that instant. 31.90 – 14.06 = 17.84, so that works but depends on recognizing the EXACT baro and MAP used in the instant. So Boost Math is Manifold Absolute pressure minus the current (instant) baro reading.

The “Baro SAE” on the hptuners chart at that instant reads 13.49. But when I ‘chart’ baro sae it shows the 14.06 psi at that instant. I suspect the difference is the refresh rate for each.

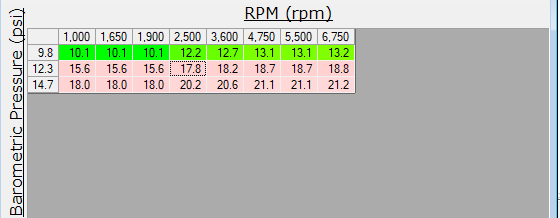
Boost/vacuum in the chart at that instant reads 18.75 psi, which is almost 1 psi higher. In the channel list it shows at 18.34 psi, which again I suspect is refresh rate. Notionally it is reading a similar thing — total MAP boost minus baro. MAP at that instant (chart) is 31.9 psi versus the channel shows MAP 31.6 psi. We know the source is not the same as boost math, since they differ. So what are boost vacuum’s source values? I observe that Boost Pressure sensor at that instant is 32.84 psi; if we subtract the chart instant baro of 14.06 we get 18.78, which gets us close to 18.75 psi, although not exact. So Boost/Vacuum appears to be the Absolute Boost sensor minus the current (instant) baro reading.

SO which is more accurate, Boost PSI (boost math) or Boost/Vaccum? The difference appears to be the difference between the 32.84 psi Boost Sensor and the 31.9 psi Manifold Absolute pressure. Why do these two sensors for notionally the same thing vary, and which is ‘more accurate’? My intuition is since there IS a Boost sensor, to use it for boost. That makes the Boost/Vacuum the “correct” boost versus the Boost Math.

ATS-V Wastegate Open Boost

Within the airflow, turbo section of the Cadillac ATS-V is the wastegate open boost table. This table looks like below. This may be the table Cadillac is thinking of when they specified that the ATS-V (under the right conditions) can hit 18 psi of boost.

The left axis is barometric pressure. At sea level that is 14.7 Psi which is 29.9 inHg. If you check the local weather often it includes barometric pressure. However, we are interested in non-altitude compensated barometric pressure. The LF4 has a couple of PIDS that relate barometric pressure; there is Barometric (SAE) and Barometric Pressure. Sometimes they are the same, sometimes they vary. My impression is they have different refresh rates

The columns are engine RPM.

So if you were at sea level, the table appears to limit boost to 15 psi at 1000 rpm, rising to 18.1 psi at 6750 rpm. So far so good.

What if you are not at sea level? Our local barometric pressure here in Texas at 700 ft altitude is 14.4-14.55 psi instead.

Here is the table with a new row added for an interpolated value at 14.4 psi.

The maximum boost available goes down with the delta between 12.3 and 14.7 (2.4) by 2.4 psi, so basically every 0.1 psi drop in baro gives us a 0.1 drop in maximum boost attainable.

Note that one can change the units for the rows to inHg or PSI in Hptuners, whatever is easiest for your analysis.

Now, actual boost at various RPM depends on how the engine is brought to that RPM. Turbos like spin time — a long pull on a dyno in 6th gear gives plenty of spin up time for the turbos. With only a WOT burst on a highway, boost will rapidly build but will not match the maximum values in the table until the turbo has time to spin up and pressurize the manifold.

Barometric pressure SAE during a WOT run for my ATS-V falls to 13.5 psi, while the barometric pressure PID stays around 14.5 psi. This may reflect vacuum at the intake of 1 psi? Regardless, if the engine uses the baro SAE it may further limit boot by a whole point, so a max of 14.7-13.5 = 2.2 and 18.2 – 2.2 is 16 psi max. That look like what people often see on the boost gauge.

For tuning, some examples I have seen simply max this table out. I prefer not to do that, as I would like controlled boost. If we are re-tuning for adding 3 psi of boost, one could simply add 3 psi to the 14.7 row. So if the ATS-V had pulled 14-16 psi in your conditions, it would now pull 17-19 psi in those same conditions. However, now the 2.4 PSI delta from 14.7 to 12.3 covers a delta max psi of 5.4, so more would be pulled at local conditions. We would need to change both the 12.3 row and the 14.7 row to add 3 psi to

Now that gives us 2.4 psi of boost delta over 2.4 psi of baro delta again, so that each 1 psi drop in baro gives a 1 psi drop in boost. If my engine is using a baro of 13.5 psi at WOT it will be 2.2 psi under 21.2 and max at 19 psi of boost.

Cadillac STS-V LC3 Boost vs Engine RPM, Gear

Taking an export from my HP Tuners datalog, I have been doing a bit more data analysis of various parameters.

Perhaps I am doing something wrong, but there appears to be a ‘hiccup’ in the csv export of the HP Tuners, in that the RPM is exported to the comma delimited file with a comma-formatted value.  For example, 2450 rpm is exported as 2,450 rpm so when imported as a comma delimited value it gets split into 2 and 450.  So, once I manually fixed that in my target file then I could import the data and begin to make some charts.

These charts show RPM across speed 0-60 mph, along with Boost at the same speeds.

RPM vs Speed vs Boost PSI

RPM is shown on the left Y axis, and Boost PSI on the right Y axis.  Speed in MPH is along the X axis.

Boost is certainly spikey measured this way.  There may also be other factors involved.

The Boost PSI is calculated by comparing the Manifold Absolute Pressure (MAP) with the V’s Barometric calculation (Baro).  One can see that the V does not shift at exactly the same RPM at 1-2 and at 2-3 although I believe they are both specified to shift at 6500 RPM.

This is the same graph with some smoothing done by averaging of values, 2 prior to and 2 after each point.

RPM vs Speed vs Boost PSI Smoothed

Finally, here is a graph showing boost in the target range of 4500 RPM to 6500 RPM with boost in 1st gear shown in blue and boost in 2nd gear shown in red:

Boost by RPM by Gear

Summary

My conclusion is that boost is in fact higher in 2nd gear than 1st gear.  This is perhaps due to more air flow into the intake at speed?  I am not certain.

On the graph Boost appears to settle around 9 PSI at high RPMs.  Boost in this dataset peaks at 9.86 PSI which in the smoothed set is 9.43 PSI.  The STS-V was designed for 12 PSI of boost.  If we assume the supercharger makes 12 PSI of boost then this reading after the Laminova tube intercooler suggests that the pressure drop of air across the intercooler is 2.57-2.14 PSI.