CarTest – Cadillac STS-V vs Driver, Temp, WHP, Final Drive, Redline, TopSpeed

I enjoyed Cartest back in the day in the dos version, and picked up the latest JAVA stand-alone version of CarTest 2000.  CarTest is a simulation that makes it easy to compare a variety of parameters for your vehicle to determine likely effect if you change that parameter.

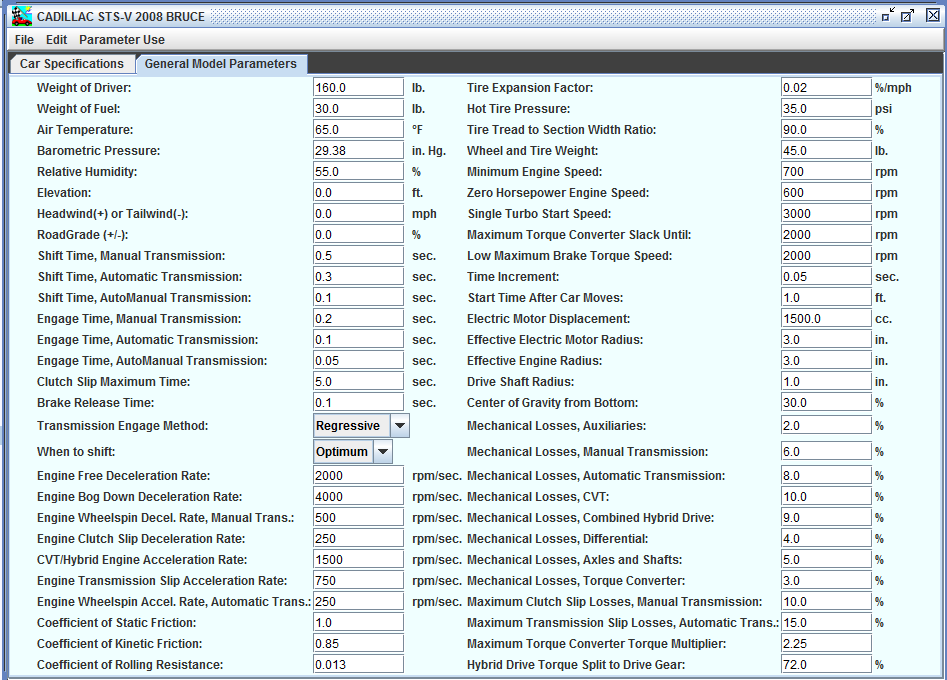
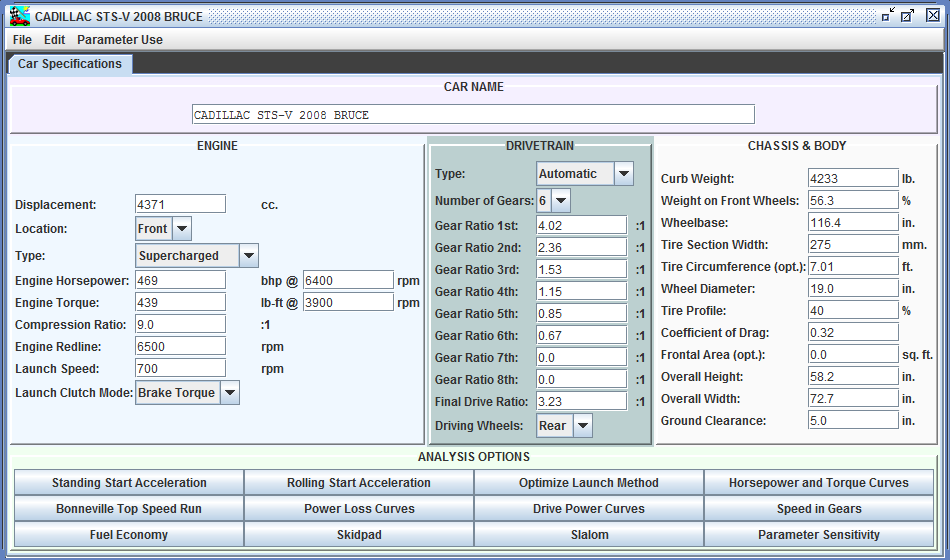
STS-V Cartest General parameters

One parameter that gave me pause is the redline.  I think of the redline for the STS-V as 6800 RPM, but I note that the ‘max shift speed’ for the 6L80E transmission is 6500 RPM, and the fuel shut-off for the LC3 is 6700 rpm, so I need to research where the V shifts further.

Cartest predicts a 2008 STS-V will go 0-60 mph in 4.68 sec with a 1 foot roll-out at 65F 29.9 baro 0% humidity and a 160 lb driver.

In my first test for my 08 STS-V at 87F and 29.69 baro humitity 64% I measured 5.39 sec 0-60 mph.  If I put these parameters into Cartest the prediction would be 4.92 sec for those conditions.  In the test I learned that I would need to launch my V carefully for the best times (no news there).

In my second test Conditions: Weather: 100F per the car, 96.5 at the weather station; baro 28.85 in I measured 5.29 sec; Cartest predicts 5.26 sec for 0-60 mph for those conditions.

I read these Cartest predictions as what I should have been able to do with the V on those days.

The car specific parameters are set by creating and modifying Car Specific parameters to be used in the place of the general parameters used below:

Car Test General Parameters that can be modified with Car Specific Files

The fun part of CarTest of course is predicting things we don’t know.  For example, I am hoping that my upcoming Spectre Intake will add 40 whp and 40 lb-ft of torque.  Here is a comparison back on the perfect 65F day with CarTest default standard conditions:

Selected Cars: 1. CADILLAC STS-V 2008 BRUCE 2. CADILLAC STS-V 2008 BRUCE SPECTRE
Time to Speed sec
0- 30 mph 1.75 1.61
0- 40 mph 2.75 2.18
0- 50 mph 3.75 3.68
0- 60 mph 4.75 4.66
0- 70 mph 6.41 6.20
0- 80 mph 8.00 7.65
0- 90 mph 9.71 9.20
0-100 mph 11.62 10.93

This resulted in the table above, predicting that the STS-V 0-60 time at 65F 29.9 baro 55% humidity with me driving with the new intake (hopefully) will drop from 4.75 sec to 4.66 sec.

The Quartermile time would have more effect — dropping from 13.35 sec @ 105.55 mph to 13.12 sec @ 107 mph.  Yes, I know that some people have done under 13 sec with modified STS-V’s, and good.  One has to consider the conditions stated, which makes a difference.

Wow you might think — add 40 hp and only get ~0.1 improvement 0-60?  How does that make sense?  The STS-V is not hp limited on the 0-60 run — it is traction limited.   Look at the whole table from 0-100 mph above and you can see a clear advantage predicted for the intake.

Another fun option to consider — what is the ideal final drive ratio for the STS-V to maximize 0-60 time:

Parameter Sensitivity - Final Drive Ratio

What this graph shows is the 0-60 time on the Y axis, using a variety of final drive ratios along the X axis.  The actual final drive in the STS-V is 3.23:1, which appears to be almost perfect for the car.

Remember my questions about the redline?  What WOULD the ideal redline be:

Parameter Sensitivity: Redline

This graph shows 0-60 mph time on the Y axis, and Redline on the X axis.  There is very little change from 6500-7500 rpm, which suggests that 6500 rpm is a good choice.

Another fun aspect of CarTest is the Top Speed Calculator.  A ‘stock’ STS-V is electronically limited to 155 mph.  CarTest estimates that on a perfect endless flat road it could do 172 mph.  The Spectre intake might raise this to 178 mph.  In a standing mile, the STS-V should hit around 149 mph at 34 seconds, so at the Texas Mile which measures from a rolling start it might do somewhat over 150 mph.  There is an overboost mode that kicks in over 150 mph after 150 seconds that drops the boost from 12 psi, but it would not come up in the time required for a mile.

I am glad I ‘refound’ CarTest, and that it is still available at all, and at a reasonable price.  Nothing replaces actually testing changes on your car, but I like to have some predicted results to use for trades: IF I do this for that much money what would happen?  Trades that one can work through without actually spending money are preferred.

I also should mention that when the Cadillac & GM Performance Division Engineers spent time getting the STS-V just right, they clearly made some good choices.

Improving a tenth at a time…

100F out today here in Texas, but testing must go on.  Mostly because inquiring minds want to know and my interest is piqued about how this could be simpler and yet any more subtle in execution.

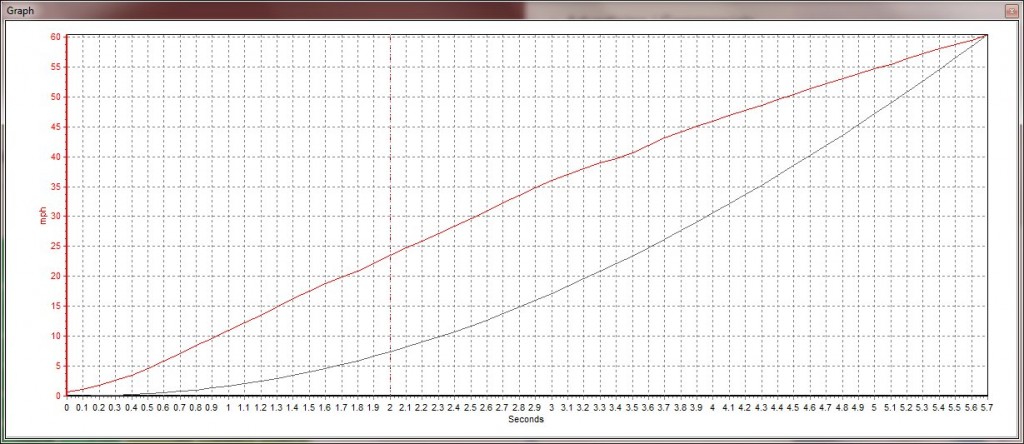
Speed vs Time (red) and Distance Travelled (gray)


And the table with comparison to last best run:

Today’s Test
Rollout Previous Test
Speed (mph) Time(s) Dist(f) 0.37 Speed (mph) Time(s) Dist(f)
10 0.93 6.33 0.56 10 0.71 7.13
20 1.71 23.73 1.34 20 1.45 23.53
30 2.53 53.59 2.16 30 2.23 51.94
40 3.43 100.4 3.06 40 3.09 96.6
50 4.45 168.07 4.08 50 4.21 170.2
60 5.66 265.64 5.29 60 5.39 265.8

Conditions: Weather: 95.6F baro 28.85 in Fuel: almost empty (car indicated 100F outside; 96F per the weather underground)

Today I wanted to try accelerating briskly until 20 mph or so then wide open throttle.  My goal was to get to 20 mph as rapidly as possible without wheelspin, figuring that even with full throttle there would be little wheel spin after 20 mph.  I was partially correct.

I also discovered that there is a cusp wherein the 6speed automatic will shift from 1 to 2 early in the low 20s if you are not at wide open throttle, which is bad for acceleration.  Manually shifting the automatic is right out because the redline at 1st comes up too fast for the manual shift to be effective.

Good news is a slightly faster best time, at 5.29 sec 0-60 with rollout.  Remember our goal is 4.9 sec 0-60 with rollout.  Low on fuel so 84 lbs lighter this run, which can also cause this difference in 0-60 times vs the earlier test.  The hotter temps act against acceleration, and 20F hotter is significant.

This simple method did improve my 1 foot acceleration time from 0.59 to 0.37 so there is that.  Also my 60′ time from a dismal 2.8 to 2.66 sec.  A reasonable 60′ time for street car on street tires is under 2.2 sec, so I am off in the first 60 ft and its me not the V.

I do think that this will be a matter of defining an exact technique to get the last few 0.1’s out however — brisk but not tire screeching acceleration up to 18-20 mph then full throttle before the transmission can decide to downshift to 2nd or similar.

In the real world it doesn’t matter much, but learning to drive the car can’t but help.

Intake update: the Spectre intakes are due from Streetsideauto.com in the next week or two, and then we’ll get before and after dyno tests run at True Street Motorsports in McKinney Texas per my  Project Cadillac Tuning Plan

Cadillac STS-V First PerformanceBox Test

I have a RaceLogic PerformanceBox which can be used to measure vehicle performance in a variety of tests.  The Performancebox is a GPS based meter and data logger.

Unfortunately, I don’t get to use it all the time, so when I do there is a short period of re-familiarization.  For my first tests, no data got written to the memory card.  After I changed the setup to “yes, please write data” things improved dramatically.

Here was the best run written to the card today:

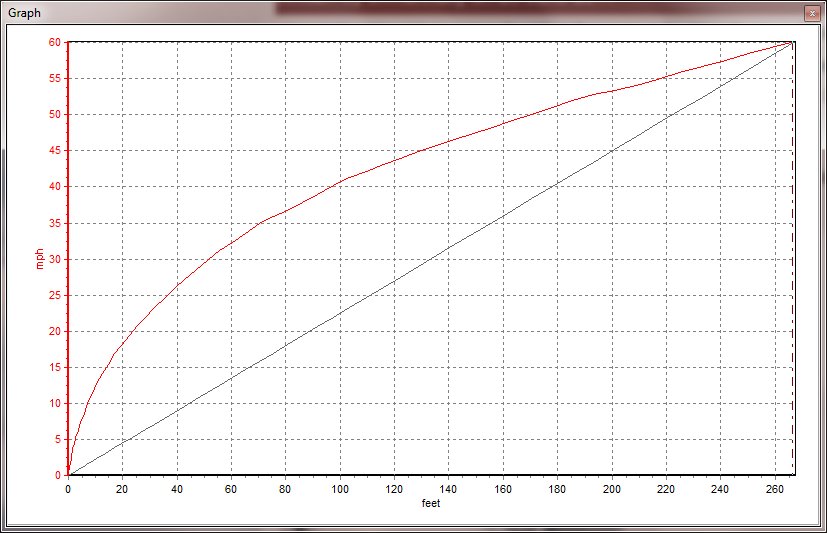
MPH vs Distance shows challenge getting off the line


Accel results
Speed(mph)     Time(s)
0-60                   05.4

With 1 ft roll-out details:

Speed(mph) Time(s) Dist(f)
0 0.00 0
10 0.71 7.13
20 1.45 23.53
30 2.23 51.94
40 3.09 96.6
50 4.21 170.2
60 5.39 265.8

Roll-out is a determination for ‘when’ the test time begins.  At a drag strip, there is up to 1 foot of roll-out before the timing lights are tripped, hence the term.  In other words, due to surface quality and wheel-spin it took me 0.59 sec to get 1 foot forward, but at the track that time would not have been included in the results and is not included above.

Weather Conditions: 87F; barometric pressure 29.69 in; humidity 64%.  Fuel: Full

Not sparkling time for the Cadillac STS-V, which Cadillac measured at 4.9 sec 0-60 mph with roll-out.  Most magazine tests ran high 4.x to low 5.x sec.  Road & Track measured 4.7 sec 0-60 mph for the STS-V.

I feel the 2008 STS-V is capable of a better time.  Getting the STS-V off the line involves a great threat of wheel-spin to be avoided.  Of course, my test area is not a sticky well prepared launch spot like at the drag-strip, but it does closely model real world circumstances.

On the bright side, this is a new ‘best’ for my personal vehicle measurements; my previous best was 0-60 in 5.95 sec in my modified CTS 3.6L and was measured on the AP-22 meter in more favorable circumstances.

Stock
STS-V


Mod CTS 3.6L
Speed (mph) Time(s) Dist(f) Time(s) Dist(f)
10 0.71 7.13 0.68 4
20 1.45 23.53 1.40 21
30 2.23 51.94 2.33 55
40 3.09 96.6 3.31 105
50 4.21 170.2 4.55 187
60 5.39 265.8 5.95 301

A line by line comparison — albeit of apples and oranges since different days, different gadgets — echoes the same issue — get the STS-V off the line faster and it would have much better times, and at 60 mph is 35 feet ahead of the CTS.