Cadillac STS-V: MAT vs IAT2 vs IAT Advance

I am continuing to study the effects and behavior trends for intake air temperatures (IAT) versus after the intercooler air temps (IAT2), versus Manifold Air Temps (MAT).

This graph is a tuner discussion taken from an .hpl download in this thread.  It is not my STS-V, just interesting to see the data from this run.  In the run the author was studying the relationship between MAT, IAT2, and the effect of IAT on timing advance (IAT Advance).

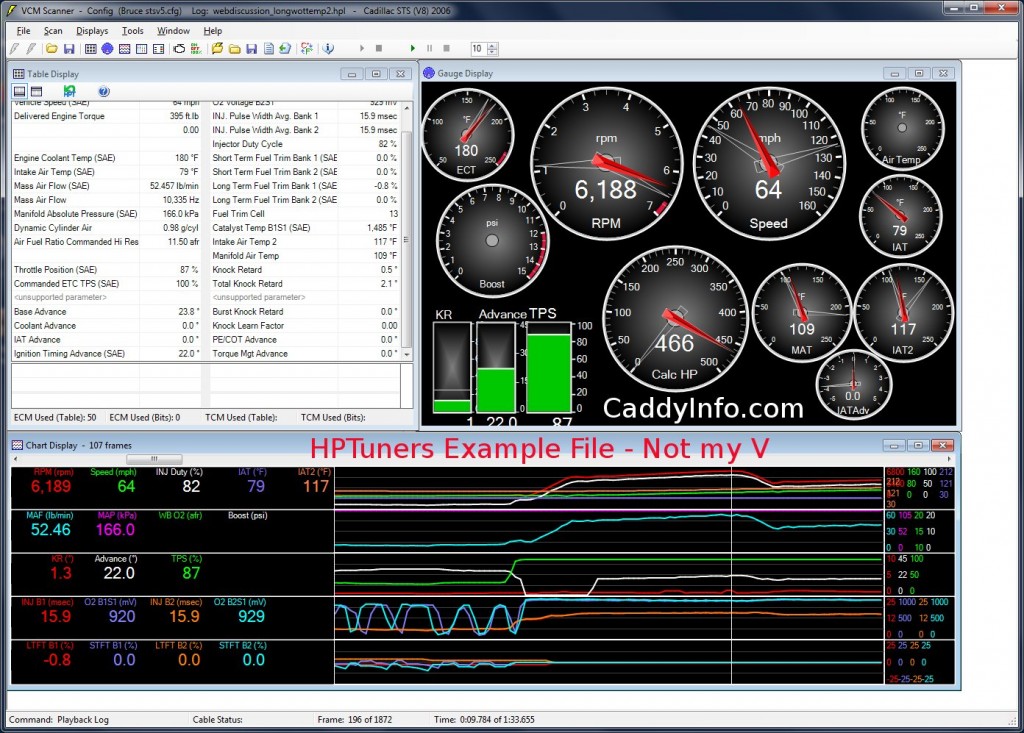
HPTuner Dashboard from a web example

What this dash shows is a moment in time as the STS-V is about to shift from 2nd to 3rd gear at 6188 RPM and 64 mph.  The IAT incoming air temperature is 79F, so a mild day.

The IAT2 is 117F, taken off the sensor.  The MAT is a predicted value for the actual manifold temperature as follows:

ok there is some hidden logic here you cannot see, the IAT2 PID displays the raw IAT2 sensor reading. The IAT Spark table uses a prediction from the IAT2 reading that is meant to compensate for the slow moving IAT2 sensor. To predict IAT2 temperatures faster than the IAT2 sensor can actually measure them. Now for the happy coincidence: The MAT value is calculated from this predicted IAT2 value (using the usual Bias and Filter tables) and for your application the bias tables are all 0. Meaning MAT = Predicted IAT2.

So in other words, the IAT2 is useful, but the MAT perhaps reflects the value that the IAT Advance will use.  What we see here is that the MAT temp of 109F the IAT Advance is 0 degrees.

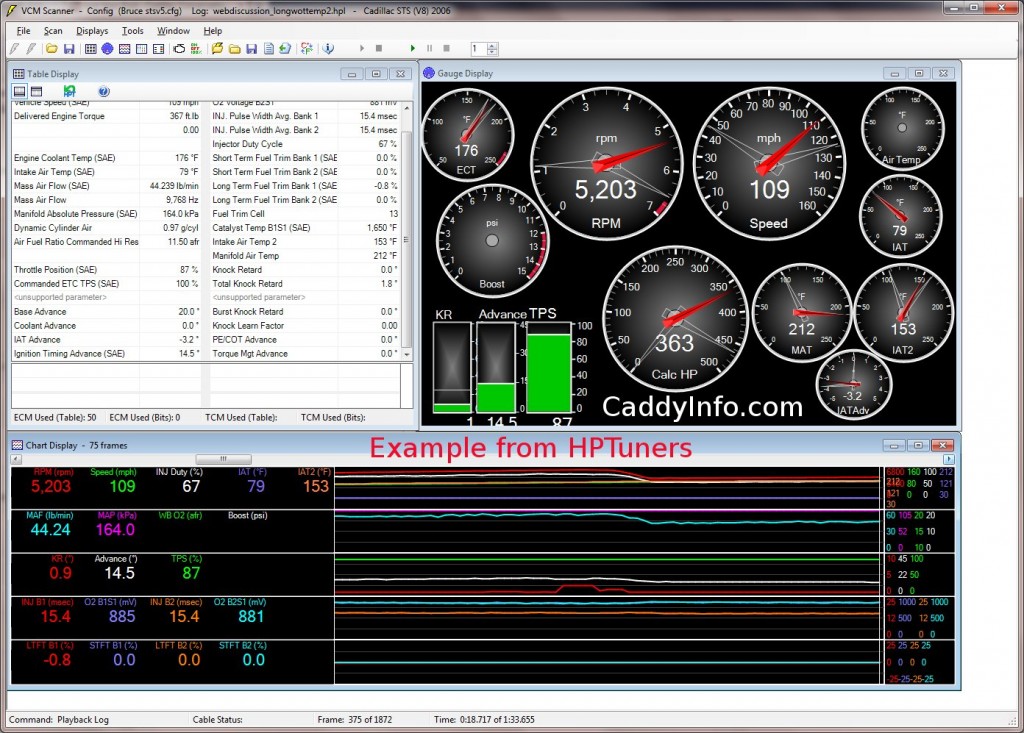
Later in the run as the MAT goes up to 212F the IAT Advance falls as low as -3.2 degrees.

Hp Tuners test drive snapshot example2

Summary:

MAT is perhaps as important as IAT2 in understanding the LC3 Supercharged V8’s responses to temperature over time.  After adding MAT to the Table display in HP Tuners one can select F instead of the default of K degrees, and same for the gauges so that MAT shows apples to apples with the IATs.

Generally the MAT changes much more rapidly than the IAT2 value, which as described is the purpose of its use.  It swings higher than the IAT2 max, but also recovers faster to lower temps.


CarTest – Cadillac STS-V vs Driver, Temp, WHP, Final Drive, Redline, TopSpeed

I enjoyed Cartest back in the day in the dos version, and picked up the latest JAVA stand-alone version of CarTest 2000.  CarTest is a simulation that makes it easy to compare a variety of parameters for your vehicle to determine likely effect if you change that parameter.

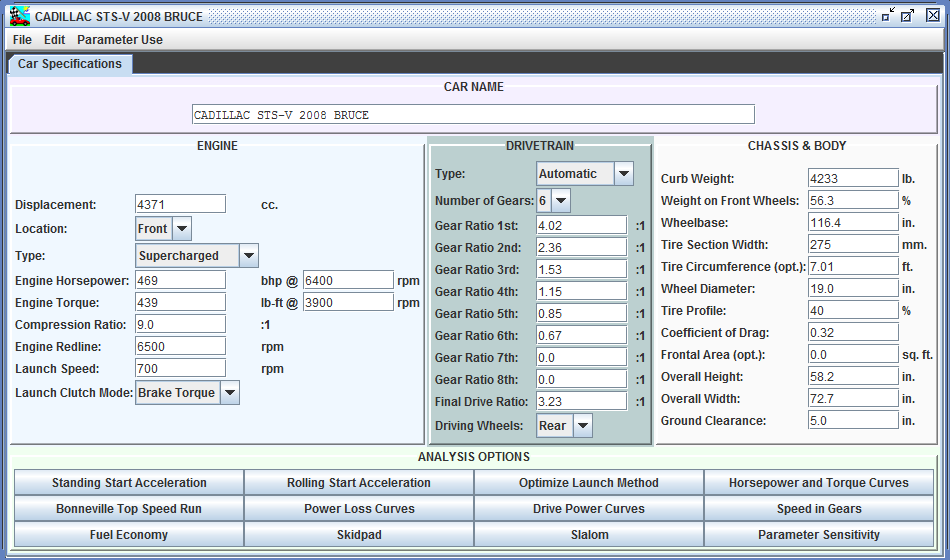
STS-V Cartest General parameters

One parameter that gave me pause is the redline.  I think of the redline for the STS-V as 6800 RPM, but I note that the ‘max shift speed’ for the 6L80E transmission is 6500 RPM, and the fuel shut-off for the LC3 is 6700 rpm, so I need to research where the V shifts further.

Cartest predicts a 2008 STS-V will go 0-60 mph in 4.68 sec with a 1 foot roll-out at 65F 29.9 baro 0% humidity and a 160 lb driver.

In my first test for my 08 STS-V at 87F and 29.69 baro humitity 64% I measured 5.39 sec 0-60 mph.  If I put these parameters into Cartest the prediction would be 4.92 sec for those conditions.  In the test I learned that I would need to launch my V carefully for the best times (no news there).

In my second test Conditions: Weather: 100F per the car, 96.5 at the weather station; baro 28.85 in I measured 5.29 sec; Cartest predicts 5.26 sec for 0-60 mph for those conditions.

I read these Cartest predictions as what I should have been able to do with the V on those days.

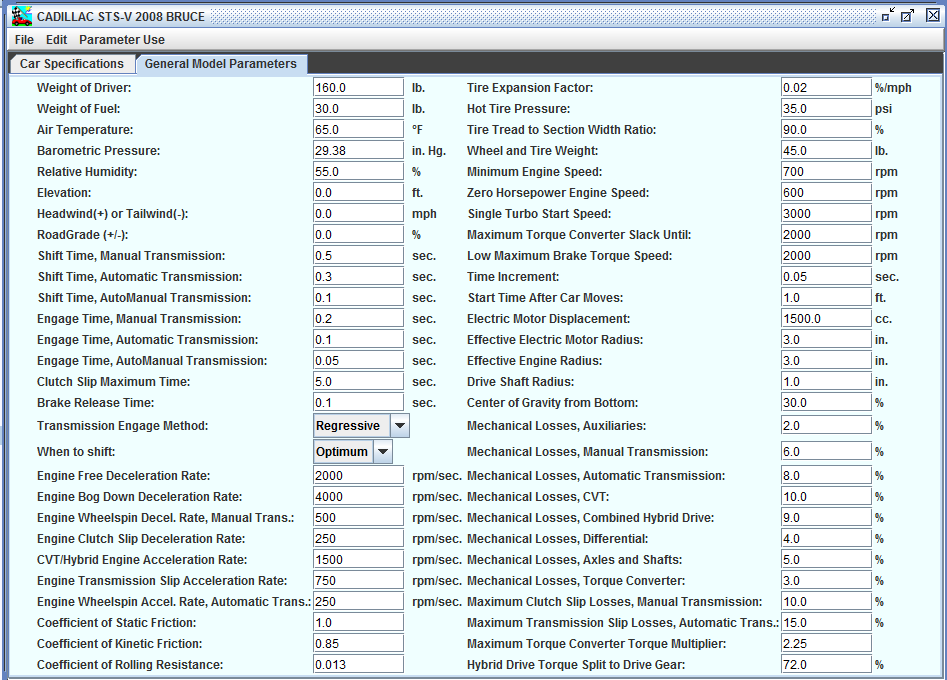
The car specific parameters are set by creating and modifying Car Specific parameters to be used in the place of the general parameters used below:

Car Test General Parameters that can be modified with Car Specific Files

The fun part of CarTest of course is predicting things we don’t know.  For example, I am hoping that my upcoming Spectre Intake will add 40 whp and 40 lb-ft of torque.  Here is a comparison back on the perfect 65F day with CarTest default standard conditions:

Selected Cars: 1. CADILLAC STS-V 2008 BRUCE 2. CADILLAC STS-V 2008 BRUCE SPECTRE
Time to Speed sec
0- 30 mph 1.75 1.61
0- 40 mph 2.75 2.18
0- 50 mph 3.75 3.68
0- 60 mph 4.75 4.66
0- 70 mph 6.41 6.20
0- 80 mph 8.00 7.65
0- 90 mph 9.71 9.20
0-100 mph 11.62 10.93

This resulted in the table above, predicting that the STS-V 0-60 time at 65F 29.9 baro 55% humidity with me driving with the new intake (hopefully) will drop from 4.75 sec to 4.66 sec.

The Quartermile time would have more effect — dropping from 13.35 sec @ 105.55 mph to 13.12 sec @ 107 mph.  Yes, I know that some people have done under 13 sec with modified STS-V’s, and good.  One has to consider the conditions stated, which makes a difference.

Wow you might think — add 40 hp and only get ~0.1 improvement 0-60?  How does that make sense?  The STS-V is not hp limited on the 0-60 run — it is traction limited.   Look at the whole table from 0-100 mph above and you can see a clear advantage predicted for the intake.

Another fun option to consider — what is the ideal final drive ratio for the STS-V to maximize 0-60 time:

Parameter Sensitivity - Final Drive Ratio

What this graph shows is the 0-60 time on the Y axis, using a variety of final drive ratios along the X axis.  The actual final drive in the STS-V is 3.23:1, which appears to be almost perfect for the car.

Remember my questions about the redline?  What WOULD the ideal redline be:

Parameter Sensitivity: Redline

This graph shows 0-60 mph time on the Y axis, and Redline on the X axis.  There is very little change from 6500-7500 rpm, which suggests that 6500 rpm is a good choice.

Another fun aspect of CarTest is the Top Speed Calculator.  A ‘stock’ STS-V is electronically limited to 155 mph.  CarTest estimates that on a perfect endless flat road it could do 172 mph.  The Spectre intake might raise this to 178 mph.  In a standing mile, the STS-V should hit around 149 mph at 34 seconds, so at the Texas Mile which measures from a rolling start it might do somewhat over 150 mph.  There is an overboost mode that kicks in over 150 mph after 150 seconds that drops the boost from 12 psi, but it would not come up in the time required for a mile.

I am glad I ‘refound’ CarTest, and that it is still available at all, and at a reasonable price.  Nothing replaces actually testing changes on your car, but I like to have some predicted results to use for trades: IF I do this for that much money what would happen?  Trades that one can work through without actually spending money are preferred.

I also should mention that when the Cadillac & GM Performance Division Engineers spent time getting the STS-V just right, they clearly made some good choices.

Adding boost pressure to the LC3 4.4L DOHC VVT V8

The Cadillac STS-V (2006-2009) uses the 4.4L supercharged Northstar engine, making 469 hp and 439 ft-lb of torque.  Can it make more?

Cadillac used a modified variant of the Magnuson MP122, or Eaton M122 supercharger, with a integrated intercooler using Laminova cores.  The powerplant was designed specifically to be supercharged.  The stock LC3 V8 uses 12 psi, or pounds per square inch, of supercharging.  In other words, if atmospheric pressure is 14.7 psi, then air flooding into the LC3 at maximum pressure is 14.7 + 12 psi = 26.7 psi.  In supercharger terms, it is at 26.7 / 14.7 = 1.82 pressure ratio.

As a rule, 1 psi of supercharging makes 4% more horsepower.  Technically, 14.7 psi of supercharging would make 100% more power, or 6% per PSI.  But, with inefficiencies, 4% per PSI is an achievable thumbrule.  Looking at this backwards, one might find that a non-supercharged 4.4L V8 would have made 316 hp.  This is very close to the 320 hp rating of the 4.6L VVT DOHC normally aspirated Northstar; no surprise.

So what would happen if we increase the boost level on the LC3 V8 from 12 psi up to say 14 psi or 17 psi?  Notionally, in a perfect world the 469 hp stock would increase to 492 hp at 14 psi, or to 530 hp at 17 psi.  However, there are issues to be considered such as the capability of the supercharger to make that much pressure efficiently, as well as the capability of the intercooler to take away additional heat produced.

A popular way to increase the output pressure of a supercharger is to substitute a smaller pulley for one or the other end or both ends of the supercharger pulley drive.  For the STS-V LC3, the crank pulley appears to be 5.88″ outer diameter, and the supercharger snout pulley is 2.8″ outer diameter.  Actually, I know the snout pulley diameter of 2.8″, and Cadillac said that the ratio between the two was 2.1:1.   Also, when D3 created a 10% overdrive pulley, they chose to make it 6.47″ outer diameter, which is 10% more than 5.88″.  This strikes me as an odd outer diameter, but note 5.9″ = 15 cm, so perhaps the crank pulley is metric?

Another choice is to change the supercharger snout pulley from 2.8″ to 2.55″.  Remember our ratio — crank:snout pulley ratio so 5.88:2.8 stock = 2.1:1

If we change the crank pulley to 6.47″, then the pulley ratio changes to 6.47 :2.8 = 2.3.  Now 2.3/2.1 = 1.1, or 10% faster, so 10% more boost, or 1.2 psi increase.

Likewise, a 2.55″ snout pulley would be 5.88:2.55 = 2.3 and 2.3/2.1 = 1.1 or 10% faster, so 10% more boost, or 1.2 psi increase.

Either way, 1.2 psi increase for 1.2 * 0.04 /psi = .048 or 4.8% increase.  So a 13 psi LC3 might increase from 469 hp at the crank to 491 hp at the crank or 24 hp.

In an ideal world then, another PSI of boost would also add another 24 hp.  For example, if we used a 6.47″ crank and 2.55 supercharger snout pulley for 6.47:2.55 = 2.5:1 ratio we could get to 2.537/2.1= 1.21 or 21% increase or 2.52 PSI. This would theoretically gain 47 hp and get from 469 to 516 hp.

A different approach is taken with the Stiegemeier Snake Bite kit.  By modifying the internal gearing on the supercharger, and porting and cleaning up the flow paths within the supercharger, up to 17 PSI of boost is produced with the stock/OEM supercharger snout pulley and crank pulley.    Theoretically this would gain 5PSI * 4%/PSI = 20% or 93 hp, boosting the LC3 from 469 to 563 hp.  However, again with real world inefficiencies the actual gain would be expected to be less.  I don’t see a claimed/measured gain on their website for this application.

So how do people get up to figures like 461 whp (wheel hp, or hp at the wheels on a dyno) or 576 crank hp (hp at the crankshaft on an engine test dyno) for the STS-V LC3?  Through a careful combination of a variety of modifications.

The actual boost the engine pulls has to overcome the intake resistance.  So add a higher flow intake and the engine effectively has more boost as a result.  Add more intercooler cooling and the engine can make and sustain more power.  Tune the engine for a specific car and environment and the engine can make more power.    Through careful tuning and multiple dyno runs the community and Professional Tuners have slowly pulled higher levels of performance from the LC3.

With the CTS-V release and adoption of the LSA supercharged 6.2L V8, there is less market for LC3 tuning and the focus has shifted to the newer cars.  That does not change the inherent goodness and balance of the 4.4L Supercharged LC3 engines, and I am having a great time considering and researching tuning approaches for mine.

HEY!

See anything you disagree with?  Did I get it ALL wrong? Do you agree and want to share your experiences?  Put a comment up and join the conversation!