Areas addressed: (1) Set AFR to 12.25 (2) spark advanced reduced 1-2 pts at WOT range of 1.16..1.32 4500-6500 to address KR (3) Boost max limit up 0.4 to allow more boost; (4) Pressure delta up 0.05 to build boost faster (5) boost knock airmass max 1.34 to allow more desired boost (6) TUTD set to autoshift 1/2/3/4 (speed) (7) airflow turbo base DC added 5 to 1.6/2500->3/6750 to allow a higher waste gate duty cycle (WGDC).
Current Conditions Settings Mostly Cloudy 86°F Feels Like: 89°F Humidity: 63% Wind: SSE 17 mph Barometer: 29.88 in Dew Point: 71°F. SAE Air Correction Factor = 1.0176355313799041 J1349 AUG2004. Max 451.8 hp equates to 459.8 SAE J1349 hp. I remembered to test with a/c off, and in track mode. Hotter day than prior, at 87F vs 60F, hot car.
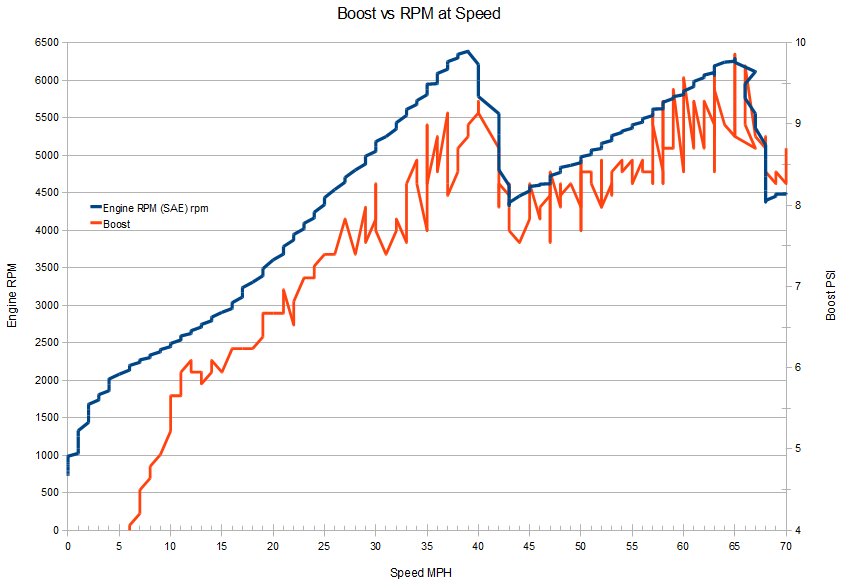
Thoughts: We are making more boost, but throttle is closing again. Absolute Boost 33 exceeded desired 32.7 as RPM climbed through 5157 RPM at 63 mph causing throttle to close even though pedal at 100%. Boost math exceeded 17.8 psi at that point; boost/vacuum 18.7 psi. Cylinder airmass 1.27 g, KR 1.1 degrees.
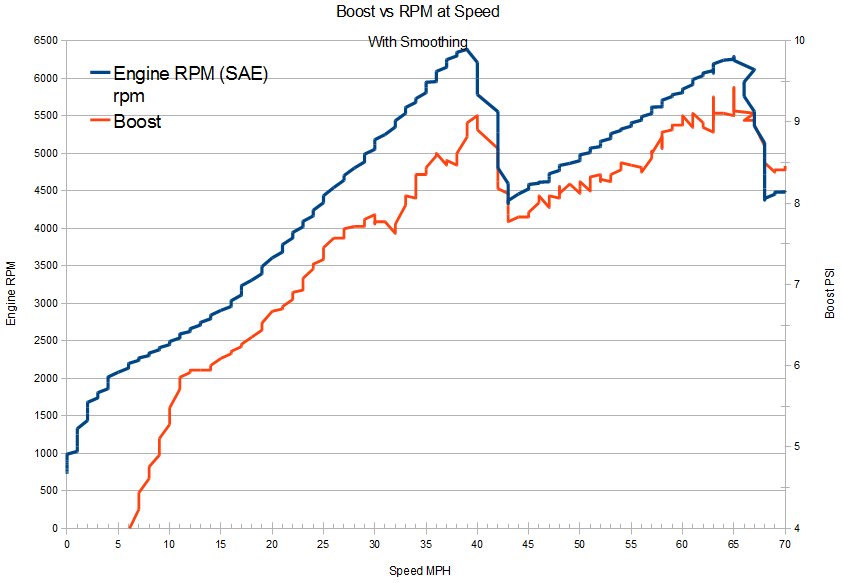
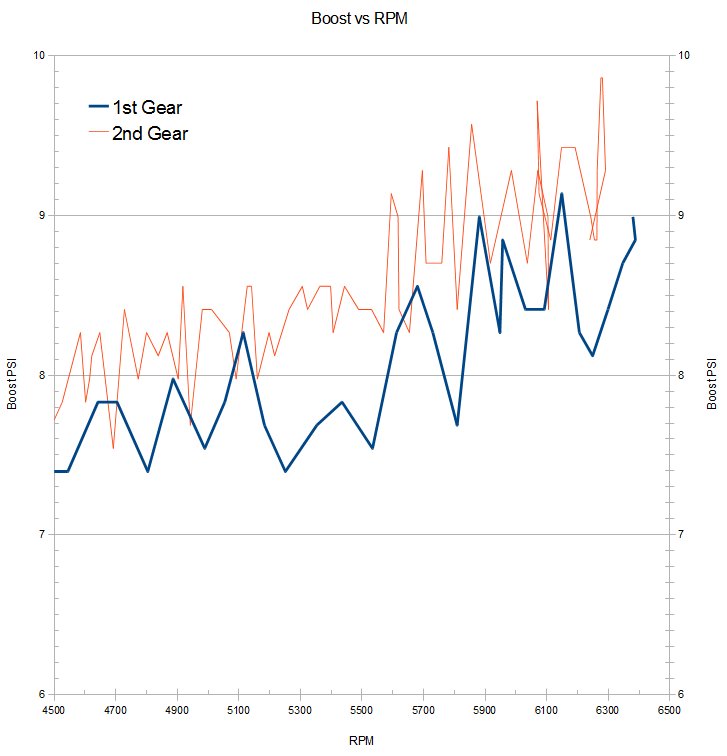
Boost math to 17 psi max in 1st gear, 18.1 psi in 2nd gear, 17.8 psi but then throttle closed in third gear. So good news we are seeing higher boost in lower gears. But more headroom needed in desired boost. Planning to add headroom in knock airmass table, or in max boost table; the manifold air temp broke over 160F on that run, which is where max boost is limited to 33.2 psi. Overall another run with the same tune but cooler air would be interesting.
Still some KR in the 1.16 to 1.32 pressure ratio, 4000 to 6000 rpm, even after I removed 2 degrees of spark here; although it responded to initial removal of 1/2 of the spark it didn’t respond to removal of the other 1/2. I changed the AFR at the same time, however. It may prefer less lean?
The transmission adjustment I made to add automatic shift to tap up / tap down (TUTD) mode was not successful. I changed TUTD vs speed but not vs RPM, which is set to 7K. I will add RPM limits to match pattern A or B for tune E.
Boost solenoid DC: I added 5% duty cycle from 1.16 to 1.32 pressure ratio, 2500 to 6750 in an attempt to get more boost earlier. The duty cycle hits 60% in 1st and 2nd and close in 3rd before the throttle opens. Appears to be working as intended but helped exacerbate the throttle closing.
Scanner note — switched to latest beta 4.11.1374. Several channels previously scanned successfully disappeared for some reason; not clear why.
Next steps: Raise PE to 12.7. Address TUTD shift RPM. Adjust Turbo Knock Mass to raise desired boost. No change to spark map. Re-initialize scanner with car to understand missing channels. Modify TCC pressure apply ramp to reduce TCC slip. Rescan.


