DIY Spray Detailer Cadillac experiment

While Jims_97_ETC was in town to pick up his 2011 Cadillac CTS-V,  we were discussing the  topic of spray detailer.  I actually meant to pick up a bottle of spray detailer to tuck in his Cadillac for the drive back, but didn’t get that done by Saturday.

IMG_0356

Spray Detailer is a product used for touch-up clean-up of an automobile when you don’t have time or need a full wash.  So let’s say you get a new, clean car, and get one spot on it on the way back home.  You’d spray just that spot with the spray detailer, then wipe off with a micro-fiber towel, and the car would be clean again.  No muss, no fuss.

The spray detailer provides a quick spot-rinse, soap to lubricate and lift the dirt, and liquid wax to provide some shine.  A microfiber towel helps pull the dirt off the vehicle without scratching the paint.

Spray Detailer is relatively expensive, costing around $8 for 16 oz of the stuff.  When I was trying to describe to Jim the goodness of Spray Detailer it occurred to me that I should have been able to just hand him a spray bottle with water, wash & wax concentrate, and mark it ‘done’!  Why buy when you can DIY (do it yourself)?

Materials:

  • Professional quality spray bottles (Around $5 for 6 at Sam’s Club)
  • Car wash concentrated solution, especially a wash & wax solution
  • Clean Water
  • Microfiber towel

Recipe:

Follow directions on the car wash solution for dilution — basically add 1 or 2 ounces of car wash solution then fill up the rest of the spray bottle with water.
Mix thoroughly.  I actually used Turtle Wax Concentrated Car Wash (will not spot or streak) that I had a gallon of in the garage, and tap water.  Filtered water would be a reasonable mod here.

Use:

Spray the DIY Spray Detailer on the problem area / bird poop / dirt.
Wipe away with a microfiber towel.

Okay Bruce, but How do you know DIY Spray Detailer works?

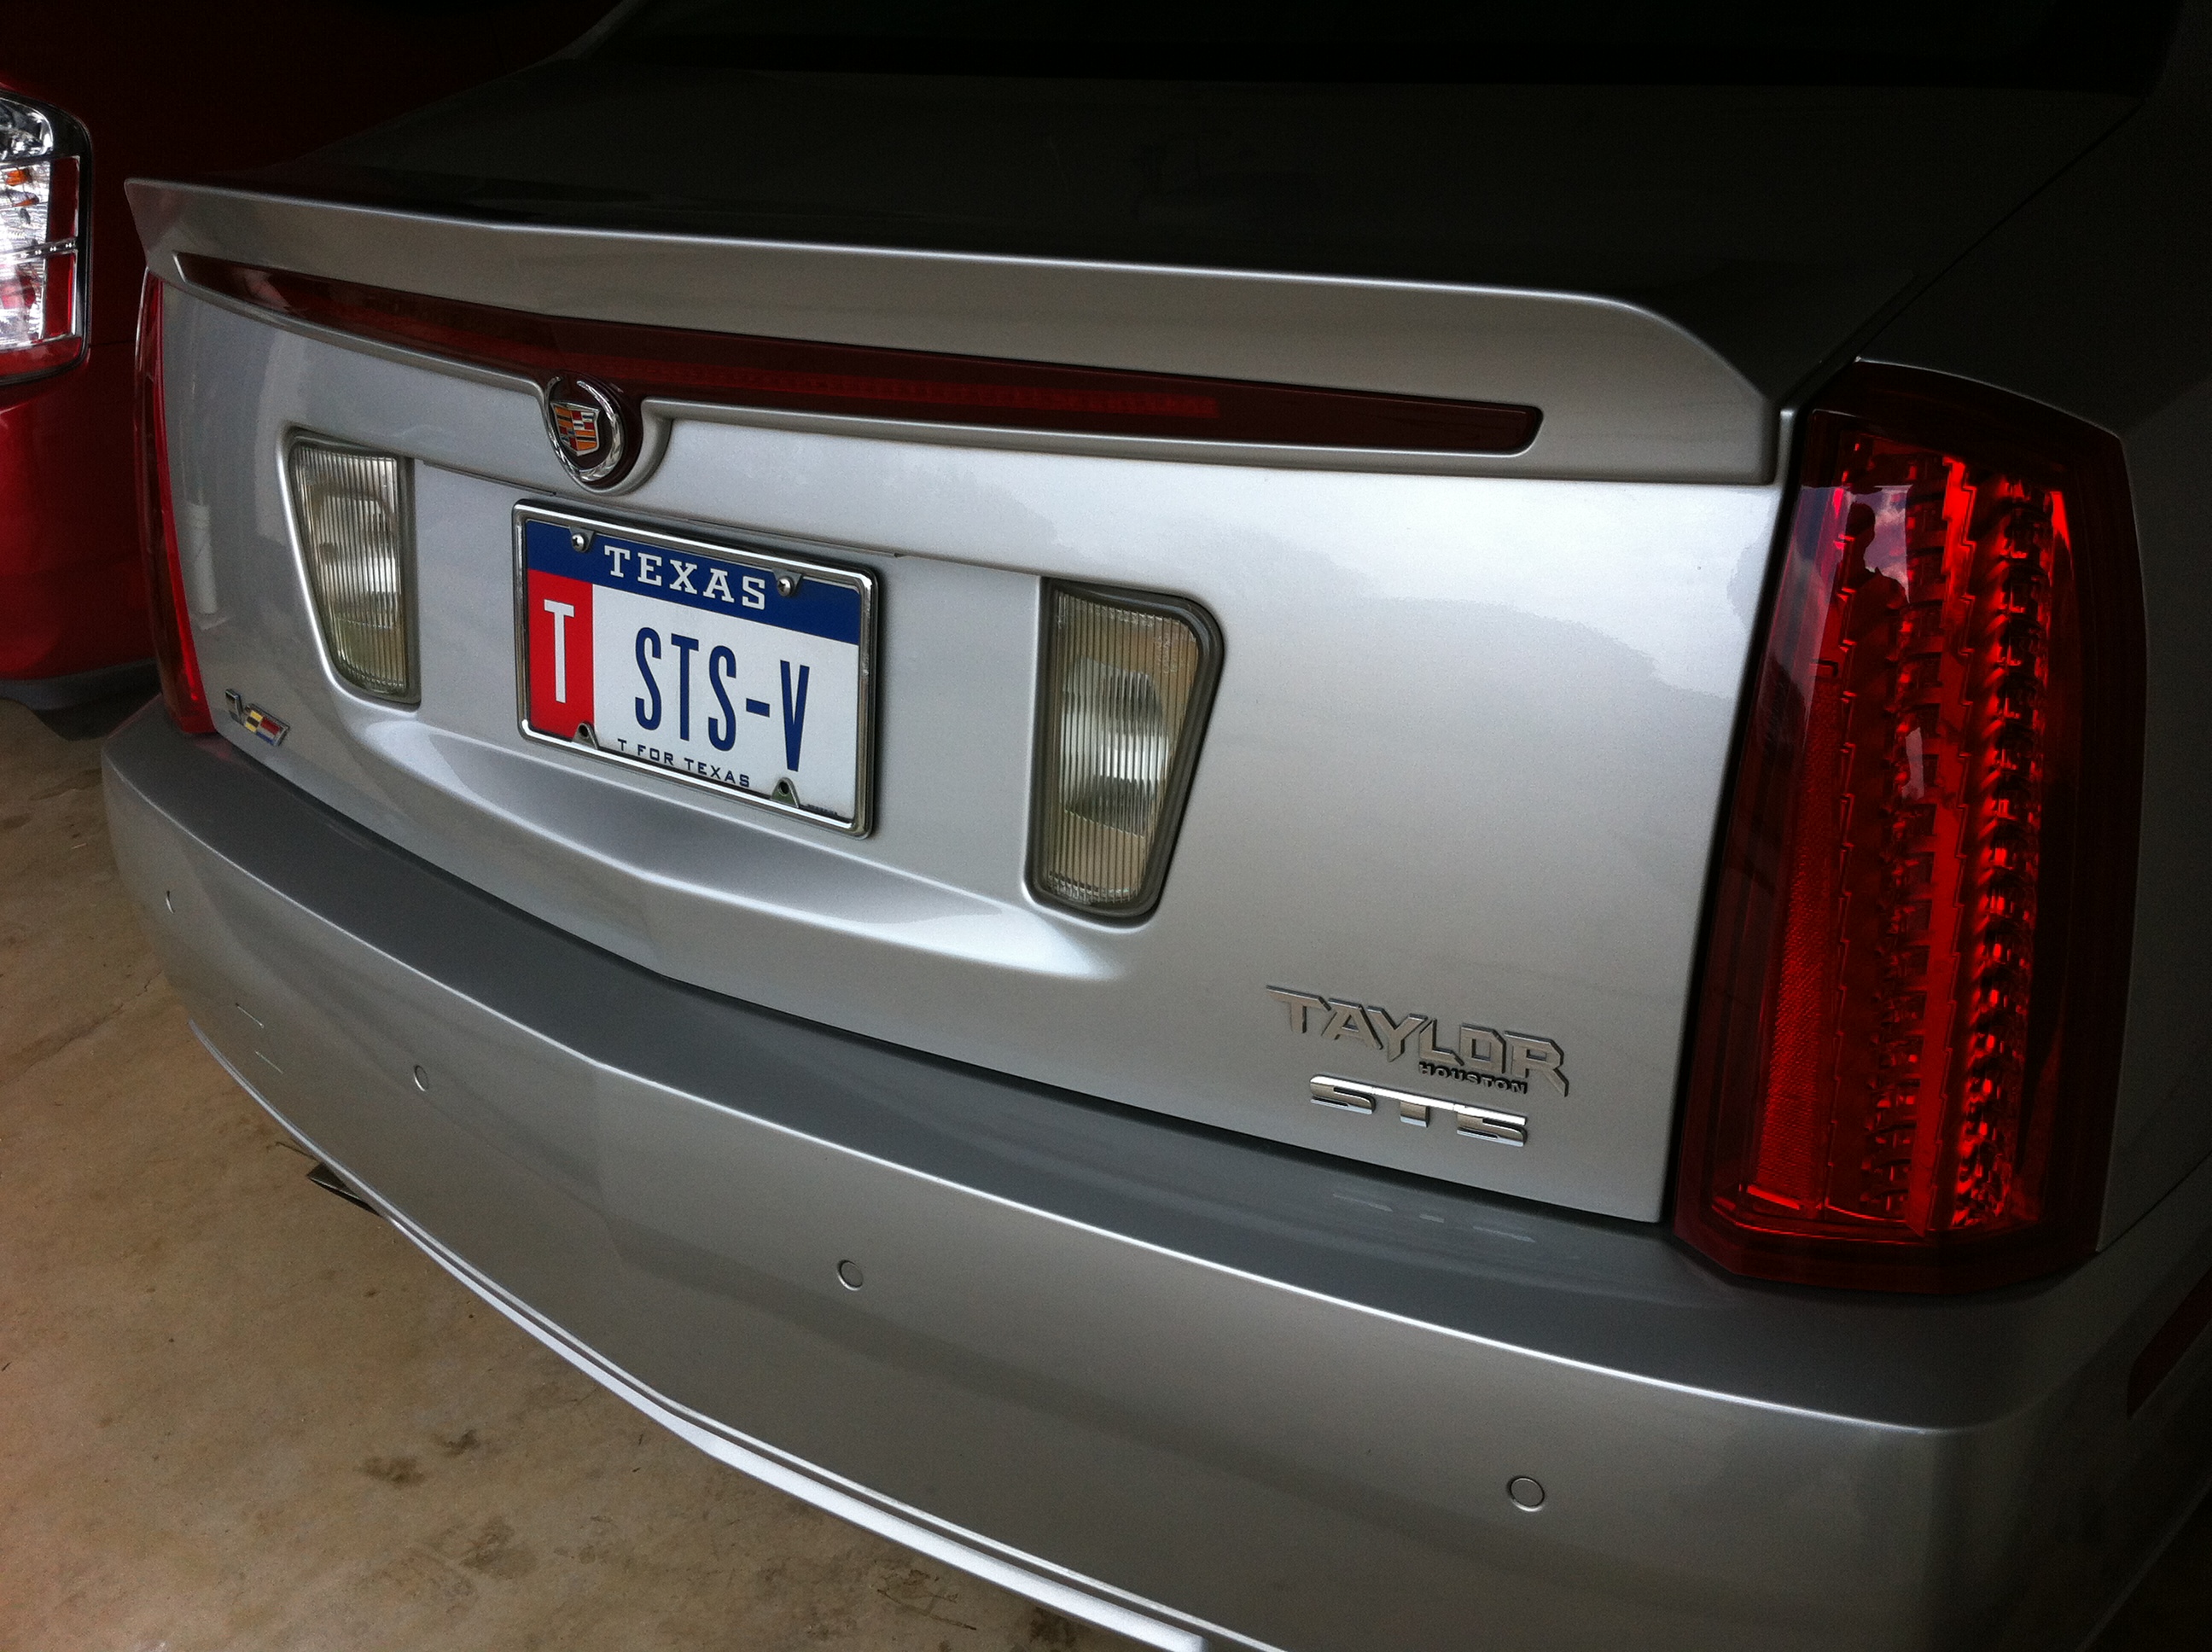
My first test was on my own prized 2008 Cadillac STS-V of course.  In the photo above you can see the ‘after’ shot.  The back of the Cadillac gets a light film of dirt due to the aero parts working — the back catches dirt that can’t come off the spoiler with the air and stays there.

As soon as I sprayed on the DIY Spray Detailer I could see dirt lift and stream down the paint in tiny brown rivulets.  One quick wipe with a handy microfiber towel, which along with the soap lubrication in the DIY Spray Detailer lifts dirt away from the paint, and the back of my Cadillac was shiney and clean.

I also did a quick-round of wheel cleaning, using the tight spray control to just hit the wheels and a microfiber towel to clean them off.  This worked great for cleaning the wheels, but basically blackened the microfiber towel.  I started with a used / almost done towel.  In the future I might use the DIY Spray Detailer and a wheel brush instead of a microfiber towel on tires/wheels.

Summary

if you are heading to a car show, consider an off-the-shelf spray detailer solution designed for this purpose.  If you are just trying to keep your Cadillac clean and looking good, consider mixing up some DIY Spray Detailer when needed.

I am pleased with my result and plan to continue to use my DIY Spray Detailer for spot clean-up.

Virtual Dyno by Brad Barnhill Review

Virtual Dyno by Brad Barnhill is a stand-alone software program that analyzes and presents data captures in the form of a virtual dyno graph.  It can work with a variety of datalogging formats.

I have been interested in Virtual Dyno and have read a bit about it.  Today made a good day to grab several data runs, slice them up, and compare.

Virtual Dyno data capture

I used my normal 20 minute test drive route.  I ensured that I added several 2nd gear pulls from 30 mph to 60+ mph, as I wanted to check that range at the top of 2nd gear.  I am unfortunately far from Mexico, where all true internet speed captures are done (lol), so a true 4th gear pull to 144+ mph is not in the cards today.

Virtual Dyno data preparation

To capture the data, I used HP Tuners VCM Scanner.  I exported the data file with all runs to a .csv comma delimited file.  I used VCM Scanner gauge review to find the 0-60 runs and noted the sample range for each run.  Then I used Open Office Calc to edit the .csv file, creating new .csv files with only the acceleration run of interest in the .csv file.  I renumbered the sample for each run from 1..n within that file, and named the file by the sample file name and sample range.

Although Virtual Dyno includes a file for the STS-V, it treats them as if the weight were constant for all model years, although it was not. The correct weights are 4,343 lb in 2006, 4,295 lbs in 2007, and 4,233 lbs in 08/09.  I created a custom file in the app data section for the 08 STS-V.

in addition, my STS-V has an extra inline intercooler tank (12 lb with coolant) and a ZZP front mounted heat exchanger (6.4 lbs). So my curb weight would be 4,251.

Today my car was at 1/2 fuel, so 9×6=54 lbs of fuel missing; 4251-53=4199 lbs.

Virtual Dyno screen shot

Virtual Dyno Screen Shot [click to zoom, back to return]

Virtual Dyno includes a few different dyno settings and adjustments.  Since my actual dyno was done on a dynojet I selected it.

Virtual Dyno Screen Shot

This screen capture shows Virtual Dyno crunching 3 different datalog runs from the same day. The data run file info is shown to the left, and the data runs are graphed to the right.

I wanted to compare them side by side to decide repeatability.  With many modern cars this in itself is troublesome — my 2008 Cadillac STS-V will tend to run quite differently from one run to the next.  So determining what variability is due to the software and what variability is due to the vehicle performance is tricky.

Virtual Dyno Graph

Virtual Dyno Summary

Virtual Dyno exports the graphic output into an image file, which makes it easy to use and reference.  What my runs seem to show is that the first run, while the STS-V was up to temperature, but still relatively cool, the V made the most power at 485 whp.

The other 2 runs had relatively more wheelspin, and made relatively less power, at 363 and 349 whp, although within a relatively close range of each other.

Here is the HPTuners Gauge output for the max hp run:

Virtual Dyno comparative HPTuners Gauge Output

Virtual Dyno comparative HPTuners Gauge Output [click to zoom, back to return]

Hot on the dyno before the cooling additions my STS-V made 394 whp on a dynojet dyno in 4th gear.  Assuming the virtual dyno is setup properly and interpreting the data presented, what we may see here is that there is a lot of variability in the power the STS-V produces.  Even with traction off, a lot of wheelspin in 1 causes early shift to 2nd and a longer pull with the intake temps heating up, and power reduced.

HPTuners Gauge snapshot for the lower HP [blue] run:

Virtual Dyno HP Tuners Snapshot

Virtual Dyno HP Tuners Snapshot [click to zoom in, back to return]

Virtual Dyno Smoothing 3

Virtual Dyno Smoothing 3

Virtual Dyno Smoothing

Virtual Dyno offers a range of smoothing.  Smoothing is averaging of the values relative to their surrounding values.  It has the effect of better showing average or trend information out of relatively bumpy real life data.  A smoothing choice that shows smooth data trend lines but no more than needed seems best — and consistent from run to run and day-to-day.  The upper graph has smoothing 4; the lower graph has smoothing 3.  I plan to stick with Smoothing 3.

Virtual Dyno — What does it all mean?

Virtual Dyno gives you another input to try to measure how your vehicle is performing.  It has the advantage that you can use it on the street at your leisure.  It has the disadvantage that you have to exercise more care to isolate and eliminate variables in your test method.  Otherwise you won’t have comparable tests from one day to the next.  As software I find Virtual Dyno easy to use and pretty consistent.    It is another tool in my toolbox of car metrics.  I will continue to work on repeatability.

Intercooler pump test 4: Jabsco 29 gpm pump

Update: IAT2 test results added

Today I performed an intercooler pump test on the Jabsco 50840 12v pump as a replacement for the Bosch OEM intercooler pump in my Cadillac STS-V.  The Cadillac STS-V uses the Bosch 00 392 022 006 pump.

My Cadillac has a 2nd heat exchanger, an S3 provided by Timmy C, and uses a 1 gallon AVS inline intercooler tank.  The goal of these tests is to improve intercooler cooling, which will enable the supercharged V8 to make more power.

Test setup with Jabsco pump in the loop

Intercooler pump test setup

To run a bucket test I put a FROM bucket at intercooler height, flowing into the pump and system, and out from the intercooler to a TO bucket.  This is similar to my previous intercooler pump test setup, for continuity.  I have added a TO bucket that is a mixing bucket which makes it very easy to measure output.

Predicted intercooler pump test flow:

Pump rated flow vs head pressure and system pressure curve

The Jabsco centrifugal pump does 29 gpm against no resistance, and the Bosch pump does 8 gpm against no resistance. In an actual system the pump curves overlaid with the system resistance curve predict where the pump will actually run in that system.

Intercooler Pump Test Results

In today’s test the Jabsco pump measured at a steady 2.25 gallons per 30 seconds, or 4.5 gpm (gallons per minute).  Previously, the Bosch OEM pump ran at 3.5 gpm, which would suggest the system pressure at that flow was 6 psid.  As flow increases, the resistance pressure in the system increases roughly at the square of the flow.  I expected the Jabsco pump to run 4.3 gpm, so the 4.5 gpm is good.  The Jabsco has 1/3.5 = 28.5% more flow than the OEM pump.

I still have more work to do to complete pump installation.  I will retest with the pump in place.  I will follow-up the intercooler pump test with IAT2 tests to see how the new higher flow impacts intercooler cooling.

Continuing to modify and fit check the Jabsco pump on the OEM bracket.

Intercooler Pump Test Update

Today I completed the pump install and conducted a test run with the new pump:

Intercooler pump test showing IAT2 over time during a 20 min drive

Click on the graph for a larger version.

What this graph shows is temperature in degrees F on the Y axis, over a 20 min drive on the X axis.  Spikes in the graph represent acceleration runs.  The red line is the OEM pump without the inline tank; the blue line is the OEM pump with the inline tank; the green line is the Jabsco pump with the inline tank.  Today it is 92F ambient; on the prior test days it was 90F ambient air temperature.

I read this test result to show that the jabsco pump’s greater flow allows the system to reach an IAT2 equilibrium temperature of 118-120F, an improvement of 7F.   The acceleration spike is a 20F increase, an improvement of 5F in addition to the lower equilibrium, so that at peak temps are 12f lower than previous hot day.

Intercooler pump test conclusion:

The Jabsco pump has a 1 gpm higher flow than the OEM Bosch pump.  This 1 gpm greater flow lowers the operating IAT2 temps by 7F

Ambient temp 92F; ambient air temp resets to 32f until the ecm can determine actual temps. Near gear change at top of 2nd gear.  Losing 1 degree of advance to IAT2 retard.