Cadillac ATS-V LF4 Driver Demand Table thoughts and an approach

Gone are the days of pressing the pedal down results in the throttle opening. Now the driver demand table is used to convert driver pedal input to a torque request. The engine management considers the torque request, the predicted torque output, and determines how much throttle is needed.

ATS-V driver demand table, graphs

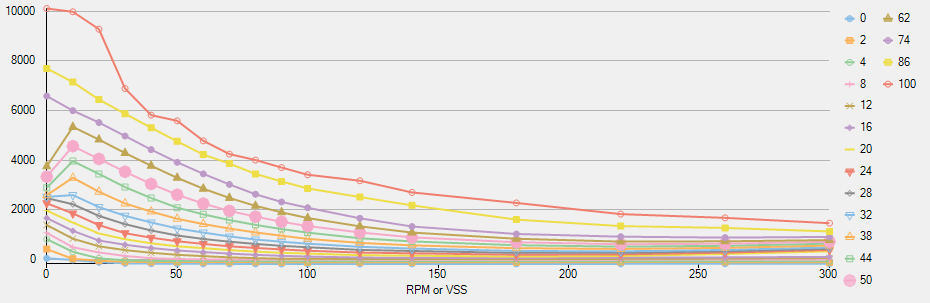
Yes, the graphs look odd. Part of this oddity is the use of speed for the column values, but the graph also reflects the impact of GEARING across the speed range.

Driver Demand Table, tabular values

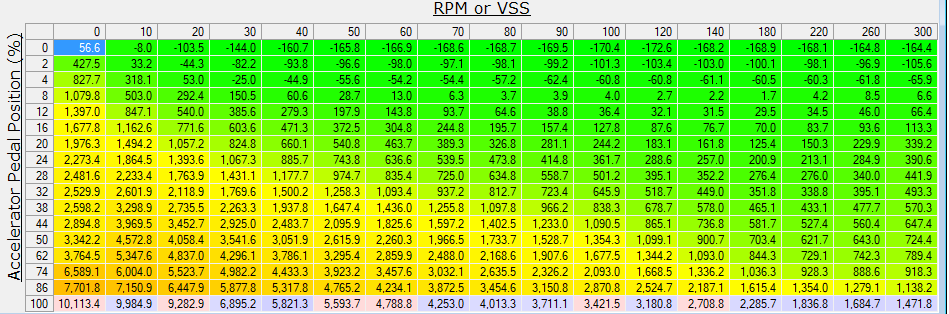
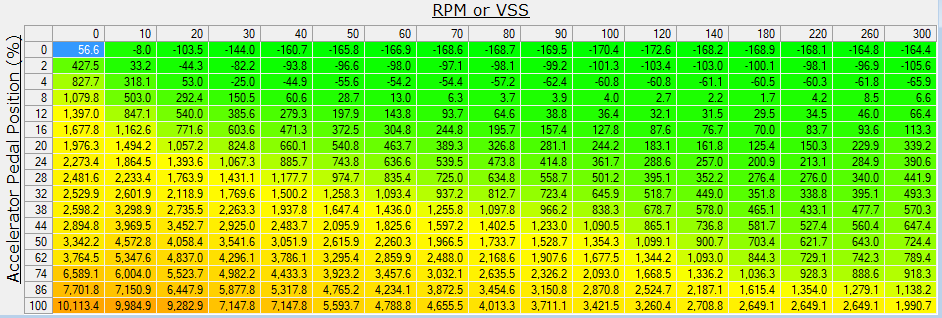
This is the same table with values shown. How do we read this table? The left axis is our pedal position, from 0-100%. So if we are at WOT, the bottom row is the row of interest. Note that not all cars have pedal position =100 at WOT. But to keep it simple, as on my ATS-V, WOT gives a 99.6% pedal position so we are operating near the 100 row.

Okay, so what is happening with the columns? The table can be RPM or VSS(speed) based. The axis here goes from 0 to 300, which suggests speed based. When you see huge numbers like these, the table is axle torque. If we saw 0-7200 numbers it would be a RPM table.

Also, conventional wisdom is this is VSS or vehicle speed in Kilometers per hour, not MPH. For an ATS-V with a max speed of 189 mph, the 300 kph table ties out to 186 mph. So that makes sense.

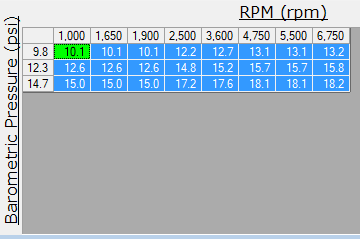
So far so good. Now let’s look at the same table in MPH

Driver Demand in MPH

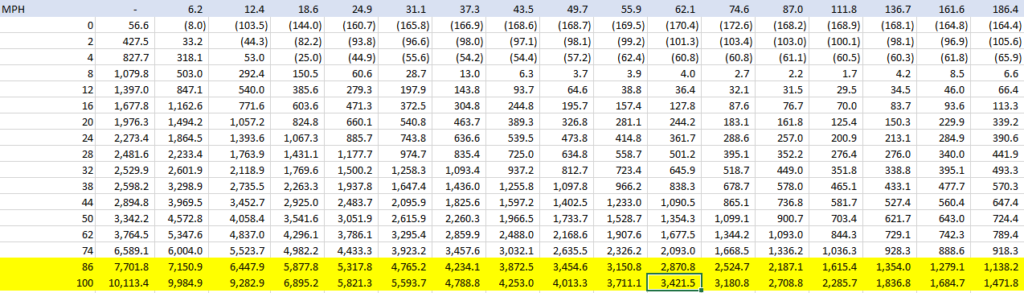
So we can see we go from 10,113 ft lbs of axle torque requested at 0 mph down to 1,471 ft lbs of axle torque at 186 mph.

Okay, but what about engine torque demand? To get to engine torque, we need to consider the tire diameter, the final drive ratio, and each individual gear ratio.

Driver Demand by gear, RPM, and Engine Torque

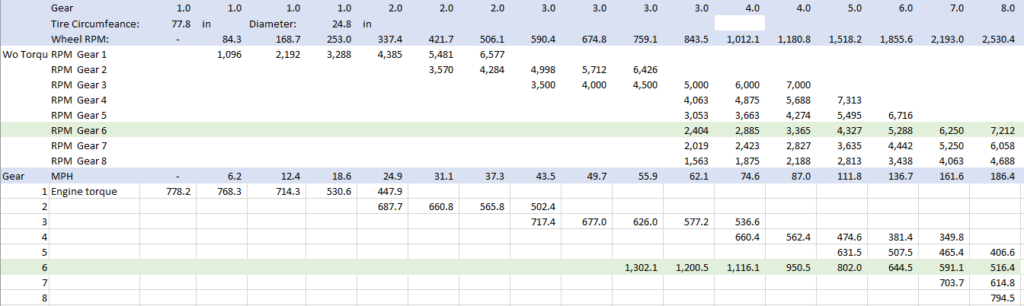
So knowing the speed, and the tire diameter, we can calculate wheel RPM. Knowing the wheel RPM, and the transmission gearing (final drive x gear ratio) we can calculate the RPM for each gear. I have ignored torque converter interaction for this purpose.

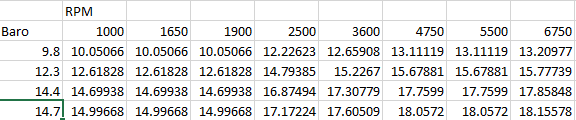
Now this give us a table with engine torque requests (limits) by RPM range.

What we observe is that in 1st gear, the stock table request is for torque from 778 down to 448 ft lbs near the shift point. In 2nd gear, from 688 down to 502 ft lbs.

Why don’t we just max the whole table out from 0-300? That will result in huge torque delta requests; one oddity of the system is that it tends to respond less rapidly to huge requests, (perhaps fearing that they are in error?) So we want to request close to what we actually need.

It also suggests how the requested torque ends up being numbers we don’t find on individual tables — they are calculated from the driver demand and converted to engine torque.

Building down to minimum requests of 550 ft lbs of torque

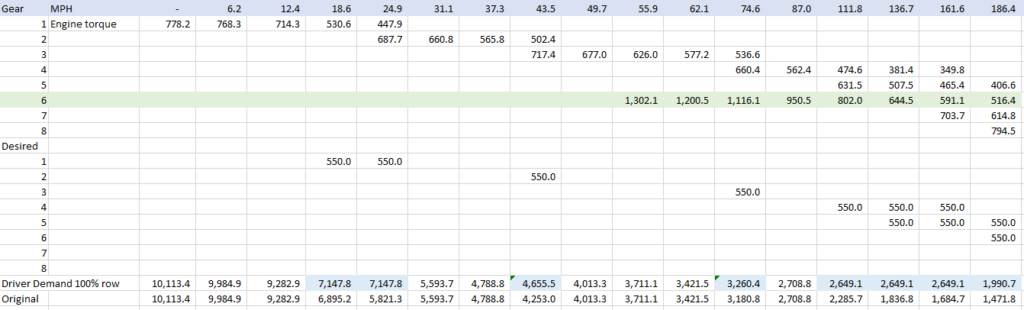
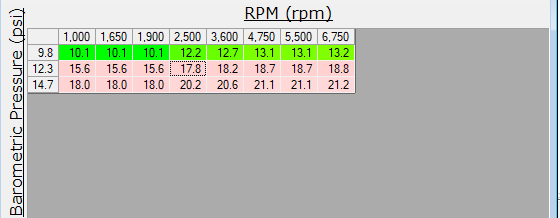
In my case I would like my driver demand to be at least 550 ft lbs minimum at any point. So where I see the driver demand for a gear and RPM would fall under 550, I have inserted a 550 in my ‘desired’ area. The final driver demand table 100% row is then a calculated row showing (blue highlights) the cells that need to be increased, as compared to the original table in the row below (marked ‘Original’).

Not every cell needs to be changed. At higher speeds, where one could be in gear 4, 5, or higher, the RPM needs for the LOWEST numerical gear (highest ratio) assure that the resulting axle torque will also exceed the desired engine torque in each higher (lower ratio) gear at the same speed.

Driver Demand G

This is the tune G driver demand table I plan for the next test.

What do you think? Please share your experiences on what has worked well, what has not for ATS-V tuning.

ATS-V Wastegate Open Boost

Within the airflow, turbo section of the Cadillac ATS-V is the wastegate open boost table. This table looks like below. This may be the table Cadillac is thinking of when they specified that the ATS-V (under the right conditions) can hit 18 psi of boost.

The left axis is barometric pressure. At sea level that is 14.7 Psi which is 29.9 inHg. If you check the local weather often it includes barometric pressure. However, we are interested in non-altitude compensated barometric pressure. The LF4 has a couple of PIDS that relate barometric pressure; there is Barometric (SAE) and Barometric Pressure. Sometimes they are the same, sometimes they vary. My impression is they have different refresh rates

The columns are engine RPM.

So if you were at sea level, the table appears to limit boost to 15 psi at 1000 rpm, rising to 18.1 psi at 6750 rpm. So far so good.

What if you are not at sea level? Our local barometric pressure here in Texas at 700 ft altitude is 14.4-14.55 psi instead.

Here is the table with a new row added for an interpolated value at 14.4 psi.

The maximum boost available goes down with the delta between 12.3 and 14.7 (2.4) by 2.4 psi, so basically every 0.1 psi drop in baro gives us a 0.1 drop in maximum boost attainable.

Note that one can change the units for the rows to inHg or PSI in Hptuners, whatever is easiest for your analysis.

Now, actual boost at various RPM depends on how the engine is brought to that RPM. Turbos like spin time — a long pull on a dyno in 6th gear gives plenty of spin up time for the turbos. With only a WOT burst on a highway, boost will rapidly build but will not match the maximum values in the table until the turbo has time to spin up and pressurize the manifold.

Barometric pressure SAE during a WOT run for my ATS-V falls to 13.5 psi, while the barometric pressure PID stays around 14.5 psi. This may reflect vacuum at the intake of 1 psi? Regardless, if the engine uses the baro SAE it may further limit boot by a whole point, so a max of 14.7-13.5 = 2.2 and 18.2 – 2.2 is 16 psi max. That look like what people often see on the boost gauge.

For tuning, some examples I have seen simply max this table out. I prefer not to do that, as I would like controlled boost. If we are re-tuning for adding 3 psi of boost, one could simply add 3 psi to the 14.7 row. So if the ATS-V had pulled 14-16 psi in your conditions, it would now pull 17-19 psi in those same conditions. However, now the 2.4 PSI delta from 14.7 to 12.3 covers a delta max psi of 5.4, so more would be pulled at local conditions. We would need to change both the 12.3 row and the 14.7 row to add 3 psi to

Now that gives us 2.4 psi of boost delta over 2.4 psi of baro delta again, so that each 1 psi drop in baro gives a 1 psi drop in boost. If my engine is using a baro of 13.5 psi at WOT it will be 2.2 psi under 21.2 and max at 19 psi of boost.

Cadillac ATS-V Tune F

Changes: Overspeed limit max increased from .5 to 1. Waste gate open boost increased 2 pts. Peak torque and max torque redone as 1.2x stock tunes. Fast torque exit set to 50/25. Boost max limit added 1. Increased knock airmass. Further reduced main spark map, high octane to address KR. Transmission: increased TCC desired pressures, regulator gain, regulator offset, reset TCC desired slip to match Corvette, changed TCC adapt torque min. Disabled TCC in gears 2,3,4.

Conditions: 81F, engine Baro 12.235 inHg 74% humidity; correction 1.037 SAE J1439.
Output: Measured max 466.7 hp at 5315 rpm, 467.4 Ft lbs torque at 5198 rpm so
Corrected 484.0 hp at 5315 rpm and 484.7 ft-lbs torque at 5206 rpm.

Goals: Eliminate KR. Reduce TCC slip rpm. Reduce throttle opening.

Results: KR was reduced at WOT pressures to under 0.5 (but not eliminated); good progress. TCC still showed slip even though TCC was not applied in gears 1-4. Unclear if that helped or not; reset to stock for next tune. Still throttle closing; going to try Sam’s driver demand map which further increases driver demand, and makes more linear. Keeping an eye on misfires; going to go a bit richer next tune, from 12.7 to 12.5 AFR (14.113/12.5 = 1.12904 PE value). Fuel pressure holding fine so far. Boost rose to 19.2 PSI then fell to 18.5 before the throttle opened around 5800 rpm; not sure why. Still seeing a flat HP curve from 5300 rpm to 6200 RPM instead of a steady increase; not sure why.

Thoughts: reduction in spark to reduce KR at high pressures may be limiting hp at high rpm. Consider a richer PE and attempting to restore spark and still avoid KR or misfire.