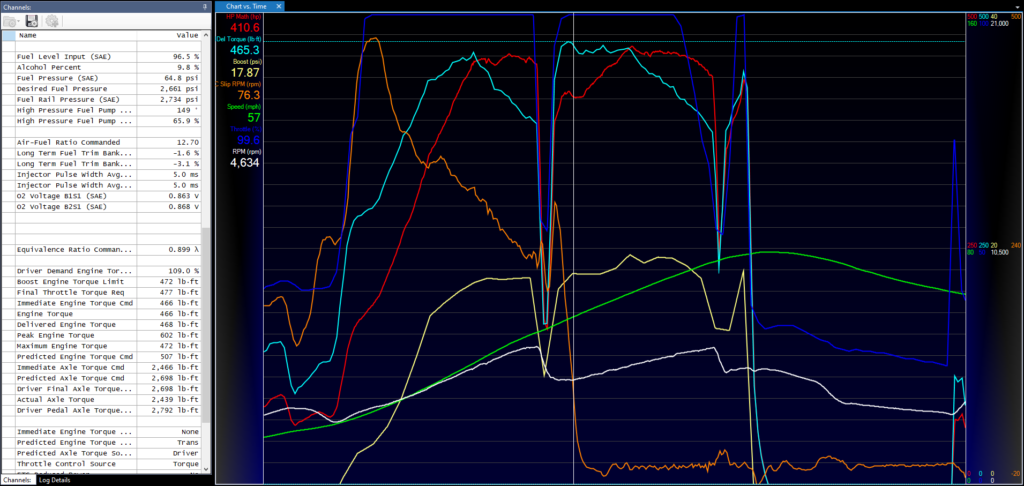
Hp Tuners view of Hp, Torque, boost, TCC slip, and Throttle at RPM
The above chart is based on a layout file for HP Tuners to help with analysis.
The red line is HP, the light blue line is Torque, across two gears, 2 & 3, from 17 to 78 mph.
The dark blue line is throttle (versus pedal input), or how much the PCM commanded the throttle. The white line is RPM.
The yellow line is boost. There is a strong correlation between the boost curve and the Torque or HP curves before/after 5252 RPM where they cross by definition. Boost holds at 17.49 psi in second, and rises to 19.47 psi in 3rd gear.
At the highlighted snapshot moment, driver demand is at 109%. After this, driver deman falls off; I am not sure why. Later in the run at 5696 rpm in 3rd gear the commanded throttle opens due to boost pressure limits being exceeded, and boost falls off after that point, crushing the HP curve from there. Those boost limits will need further attention in the next tune.
The gold line is TCC Slip RPM. I note that here in my tune E TCC slip is actually well controlled in 3rd gear, and falls across 2nd gear rev range. I plan to increase the TCC pressures across 2nd gear parameters.
Overall this layout was helpful in analyzing individual tests, and comparing across scan files for these parameters.
Areas addressed: (1) Set AFR to 12.25 (2) spark advanced reduced 1-2 pts at WOT range of 1.16..1.32 4500-6500 to address KR (3) Boost max limit up 0.4 to allow more boost; (4) Pressure delta up 0.05 to build boost faster (5) boost knock airmass max 1.34 to allow more desired boost (6) TUTD set to autoshift 1/2/3/4 (speed) (7) airflow turbo base DC added 5 to 1.6/2500->3/6750 to allow a higher waste gate duty cycle (WGDC).
Current Conditions Settings Mostly Cloudy 86°F Feels Like: 89°F Humidity: 63% Wind: SSE 17 mph Barometer: 29.88 in Dew Point: 71°F. SAE Air Correction Factor = 1.0176355313799041 J1349 AUG2004. Max 451.8 hp equates to 459.8 SAE J1349 hp. I remembered to test with a/c off, and in track mode. Hotter day than prior, at 87F vs 60F, hot car.
Thoughts: We are making more boost, but throttle is closing again. Absolute Boost 33 exceeded desired 32.7 as RPM climbed through 5157 RPM at 63 mph causing throttle to close even though pedal at 100%. Boost math exceeded 17.8 psi at that point; boost/vacuum 18.7 psi. Cylinder airmass 1.27 g, KR 1.1 degrees.
Boost math to 17 psi max in 1st gear, 18.1 psi in 2nd gear, 17.8 psi but then throttle closed in third gear. So good news we are seeing higher boost in lower gears. But more headroom needed in desired boost. Planning to add headroom in knock airmass table, or in max boost table; the manifold air temp broke over 160F on that run, which is where max boost is limited to 33.2 psi. Overall another run with the same tune but cooler air would be interesting.
Still some KR in the 1.16 to 1.32 pressure ratio, 4000 to 6000 rpm, even after I removed 2 degrees of spark here; although it responded to initial removal of 1/2 of the spark it didn’t respond to removal of the other 1/2. I changed the AFR at the same time, however. It may prefer less lean?
The transmission adjustment I made to add automatic shift to tap up / tap down (TUTD) mode was not successful. I changed TUTD vs speed but not vs RPM, which is set to 7K. I will add RPM limits to match pattern A or B for tune E.
Boost solenoid DC: I added 5% duty cycle from 1.16 to 1.32 pressure ratio, 2500 to 6750 in an attempt to get more boost earlier. The duty cycle hits 60% in 1st and 2nd and close in 3rd before the throttle opens. Appears to be working as intended but helped exacerbate the throttle closing.
Scanner note — switched to latest beta 4.11.1374. Several channels previously scanned successfully disappeared for some reason; not clear why.
Next steps: Raise PE to 12.7. Address TUTD shift RPM. Adjust Turbo Knock Mass to raise desired boost. No change to spark map. Re-initialize scanner with car to understand missing channels. Modify TCC pressure apply ramp to reduce TCC slip. Rescan.
Today let’s examine the turbocharger base DC (duty cycle)
The table above shows the base duty cycle used in closed loop boost control for the Cadillac ATS-V. Keep in mind that notionally for a waste gate, 0% is fully open, and 100% is fully closed. Left axis is desire pressure ratio, which is total manifold pressure over barometric pressure. So if the baro is 14.5 inHg for example, a desired pressure ratio of 1.2 would equate to [(14.5 * 1.2)-14.5] = 2.9 psi, desired pressure ratio of 2 would be 14.5 psi, and desired ratio of 3 would be 29 psi.
The table above then can be read this way in PSI:
This will vary with Barometer reading; I used 14.5 here as an example to help me relate what the system is doing.
We are interested at WOT, when the system is building boost from 3600 RPM to 6250 RPM.
Here is a chart of what the Boost Solenoid B is reporting in that period on one run of my ATS-V:
The gray line at the top is the boost solenoid info. It is reading on the right axis, as %. So it appears to show 50% at 4800 RPM, rising to 60% around 5800 RPM, and then falling to 50% around 6200 RPM. The rapid fall after 6100 RPM may be part of the gear shift logic near that point, I am unsure.
The boost pressure goes from 15.7 psi to 18.4 psi across this run range & gear. So if the boost is a result of the desired boost, then the desired pressure range is operating in the 2 to 2.2 rows. The base DC from the table in that range is this part of the table:
so at 4797 RPM and 16.4 psi it would be commanding around (look down the 4750 PRM column to between 14.5 and 17.4, so around 2/3 of the way between 14.5 and 17.4 so 2/3 of 4% plus 42.84) for a ~45.5% duty cycle; the observed “Boost solenoid B” value is 45.9%.
At 6000 RPM and 18.4 psi boost it would be commanding around a 60% duty cycle. The observed is 60%.
There is a nice article on this topic — waste gate DC versus boost and system design here.
My conclusion is that because we are operating at less than full waste gate DC we are ripe for adding more boost to the system by commanding higher waste gate DC.
I am a bit unsettled about the overall strategy the OEM tune follows. Let’s look at 1.8 pressure ratio. The WGDC goes from 100% at low RPM (spool up fast!) then falls to 34% at 3600 RPM, and then rises to 42% at 6250 RPM. I am unsure why there is a dip in the middle, possibly to bring boost on more smoothly once the turbo is up to speed? Similar curve at 2 pressure ratio, but there is not the same dip in the curve at 2.2 or 3, where the commanded WGDC steadily rises from ~40 to ~60.
So what is the ideal turbocharger base DC? If we raise this focus range from pressure ratio of 1.8 to 3 by 5% we would go from 40-60 up to 42-63%; 10% would be 44-66%. A different approach would be to set the table to a flat 60% across the range; remember in the larger context of the whole row we are basically curving from 100% at low RPM down to 42-60% at high RPM depending on the row. Another thought is to stay close to the OEM but to remove the divot in the 1.8 row, smoothing this row, then raising each row from 1.8 to 3.
Here is a table where the high RPM WGDC is set to 50-60% and then is smoothed from 1900 RPM to 6200 RPM.
This would impact when boost is above 8.7 PSI or so up to max boost, should spool faster, and ensure that the desired boost level is hit. The caution would be that this may produce too much boost too soon, exceeding the desired boost and causing the throttle to close. It needs some testing to see what works well within the torque management scheme.
Where in a current tune actual boost is below desire boost it would make sense to increase the WGDC base DC in that area.