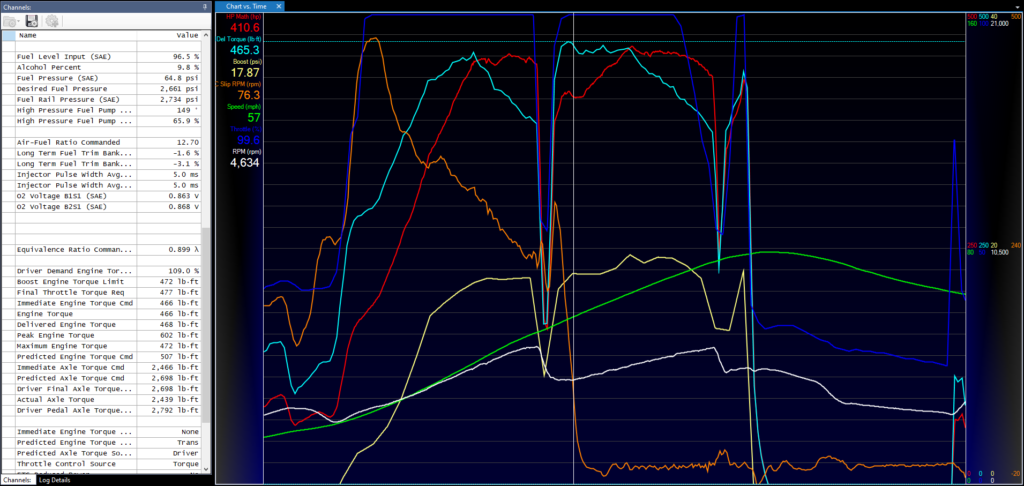
The above chart is based on a layout file for HP Tuners to help with analysis.
The red line is HP, the light blue line is Torque, across two gears, 2 & 3, from 17 to 78 mph.
The dark blue line is throttle (versus pedal input), or how much the PCM commanded the throttle. The white line is RPM.
The yellow line is boost. There is a strong correlation between the boost curve and the Torque or HP curves before/after 5252 RPM where they cross by definition. Boost holds at 17.49 psi in second, and rises to 19.47 psi in 3rd gear.
At the highlighted snapshot moment, driver demand is at 109%. After this, driver deman falls off; I am not sure why. Later in the run at 5696 rpm in 3rd gear the commanded throttle opens due to boost pressure limits being exceeded, and boost falls off after that point, crushing the HP curve from there. Those boost limits will need further attention in the next tune.
The gold line is TCC Slip RPM. I note that here in my tune E TCC slip is actually well controlled in 3rd gear, and falls across 2nd gear rev range. I plan to increase the TCC pressures across 2nd gear parameters.
Overall this layout was helpful in analyzing individual tests, and comparing across scan files for these parameters.
