Thursday evening Google+ Hangout to talk about Cadillacs. 7:30 pm Central time, 5:30 pm Pacific, 8:30 PM Eastern.
Topics: CT6 at Chengdu Auto Show, XT5 spy shots, XLR

Thursday evening Google+ Hangout to talk about Cadillacs. 7:30 pm Central time, 5:30 pm Pacific, 8:30 PM Eastern.
Topics: CT6 at Chengdu Auto Show, XT5 spy shots, XLR
Cadillac SRX once again led all models, at almost 7K sold in August 2015. Overall sales are up almost 52% for the SRX year over year, and reflect a great product in a market looking for Crossovers & SUVs. Cadillac can’t get more SRX cousins to showrooms fast enough.

The ATS led sedans at 2,449, followed by CTS at 1730 and XTS at 1531. Overall sedans were down sharply, continuing the trend on the year.
Escalade sales were strong, at 3080 total units, although down year over year. I still wonder if this year is capacity constrained there.
The extended electric ELR sales were down to 45 last month, which is below their average of around 100 a month. ELR down 9% on the year.
| August | (Calendar Year-to-Date) | |||||||
| January – August | ||||||||
| 2015 | 2014 | %Change Volume | 2015 | 2014 | %Change Volume | |||
| ATS | 2,449 | 2,804 | -12.7 | 16,544 | 20,296 | -18.5 | ||
| CTS | 1,730 | 2,592 | -33.3 | 12,934 | 20,639 | -37.3 | ||
| ELR | 45 | 196 | -77.0 | 704 | 774 | -9.0 | ||
| Escalade | 1,770 | 2,277 | -22.3 | 13,349 | 11,415 | 16.9 | ||
| Escalade ESV | 1,310 | 1,257 | 4.2 | 8,972 | 6,419 | 39.8 | ||
| Escalade EXT | 0 | 1 | ***.* | 2 | 50 | -96.0 | ||
| SRX | 6,903 | 4,545 | 51.9 | 43,863 | 38,008 | 15.4 | ||
| XTS | 1,531 | 2,978 | -48.6 | 14,423 | 16,407 | -12.1 | ||
| Cadillac Total* | 15,738 | 16,650 | -5.5 | 110,791 | 114,008 | -2.8 | ||
From the press release:
DETROIT – General Motors’ (NYSE: GM) Chevrolet, Buick, GMC and Cadillac brands sold 270,480 vehicles in the United States in August 2015. Retail deliveries climbed 6 percent compared with a year ago, when results included the Labor Day holiday. GM had the industry’s largest retail sales increase and gained more than 1 percentage point of retail market share year over year, based on J.D. Power PIN estimates. Fleet sales were down 24 percent on a 38 percent decline in rental deliveries. Total sales were in line with a year ago.
GM continues to have the highest average transaction prices (ATPs) and had the lowest incentives as a percentage of ATP in the domestic industry, according to PIN.
“GM’s retail sales increase far outpaced the industry in August, and we have grown our retail share for five months in a row compared to last year,” said Kurt McNeil, GM’s U.S. vice president of Sales Operations. “We will continue this momentum with the redesigned Chevrolet Cruze and Malibu, the launch of diesel engines for our midsize pickups, a dramatic restyling of the Chevrolet Silverado and the aggressive rollout of Apple CarPlay and Android Auto.”
GM’s outperformance came in a very strong month for the industry. The estimated seasonally adjusted annual selling rate (SAAR) for light vehicles was 17.5 million units in August, the fourth month in a row above 17 million units – a streak unmatched since 2006.
“All of the economic fundamentals that we look at, including job growth, disposable income and fuel prices, are in good shape and that should keep sales strong,” McNeil said.
Cadillac
The SRX crossover was up 52 percent.
The LH2 V8 added variable valve timing (VVT) based on the Premium V6 schema of the same time. Interestingly, the LH2 and the LC3 use the same base cam timing, which reinforces how much the LC3 Supercharged V8 in my STS-V is a supercharged 4.4L LH2. It may also give us some insights into how the LH2 VVT is programmed vs the LC3 VVT.
Here in Plano, Texas we stay in the High BARO table, so we’ll be looking there. The same principles should apply in other barometer ranges.
Here is the OEM calibration for the intake and exhaust cams at high baro. During WOT my LH2 operated around .57 g/cyl airmass so I have blue-lighted the .56-.60 areas: [click to zoom in, back to return]
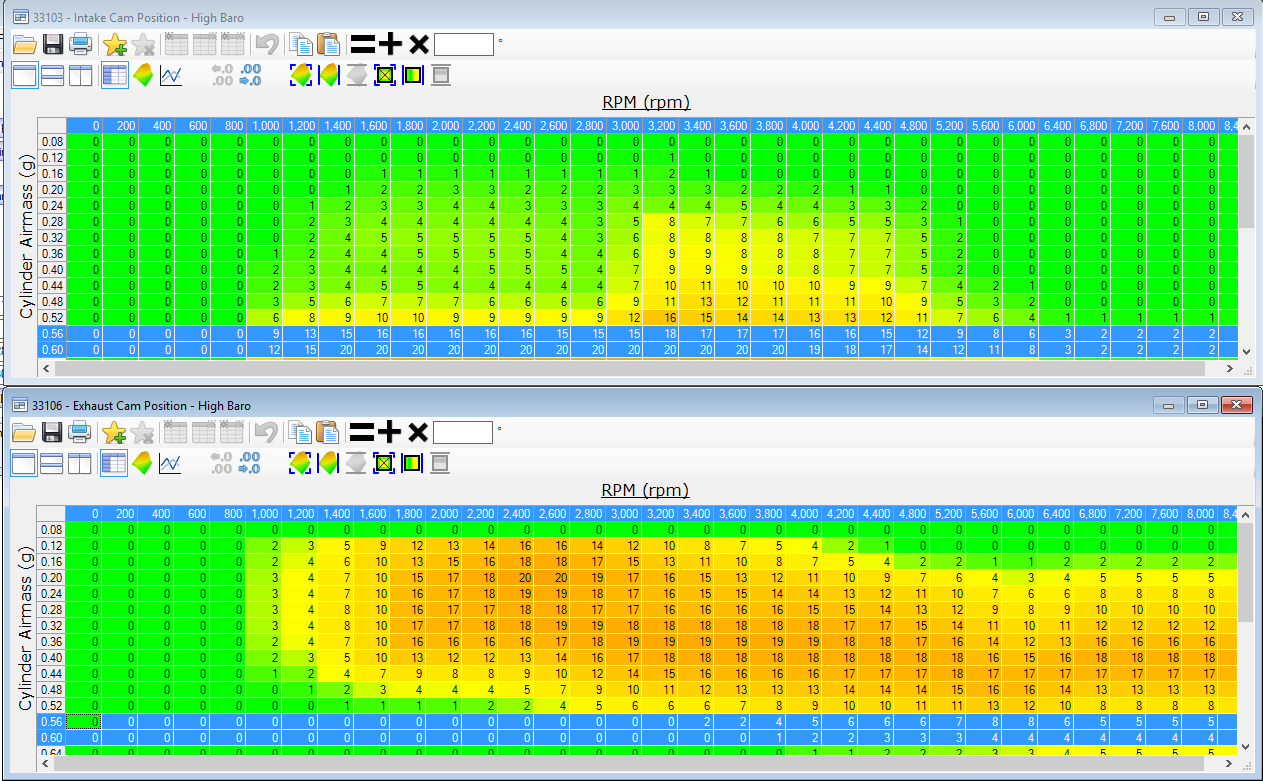
What we see is that the intake cam goes from 16-19 degrees at 4400 rpm down to 2 degrees at 6800 rpm. The exhaust cam goes from 3-6 degrees at 4400 rpm to 4-5 degrees at 6800 rpm.
The values for the intake cam should be degrees of advance, and the values for the exhaust cam degrees of retard. For the LH2 it appears 0 degrees of either are Top Dead Center (TDC) [ref: Helms manual pg 9-340]. If that is the case, as the engine moves to high RPM the intake cam gets less advanced (retards), and the exhaust cam gets more retard (retards).
Simple cam tuning rules for Naturally Aspirated engines like my LH2: [ref]
So as the engine moves to higher RPM we want to see both cams retarding, and that is what we appear to see. We would also like to see more overlap, and that is not what we see — the net change between the two cams appears to introduce more overlap not less.
I am interested in the changes over cylinder air mass within the table. At lower cylinder airmass the changes have the same basic shape, but to different degrees.
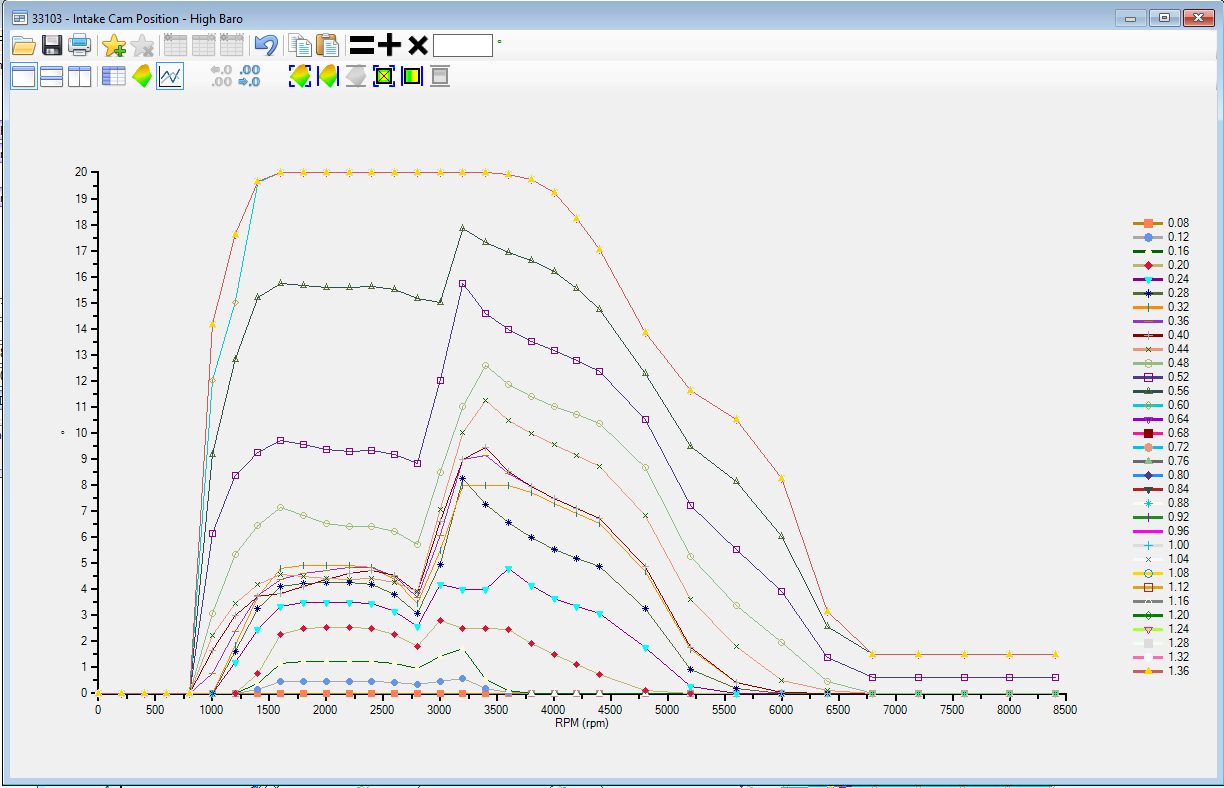
This graph shows the degrees of intake cam (left axis) vs rpm (bottom axis) at various gram/cyl air pressures. The top two lines are our lines of interest, which seems odd, but because the graph maxes out at that point every other range over-writes the top line.
I think our first step will be to begin logging the intake and exhaust cam positions in order to verify that there are not other tables having an impact on these values.
What do you see in the data? How would you tune these values for low-end torque and high end power?