More Air Filter Testing – K&N on Spectre CAI Cold/Full

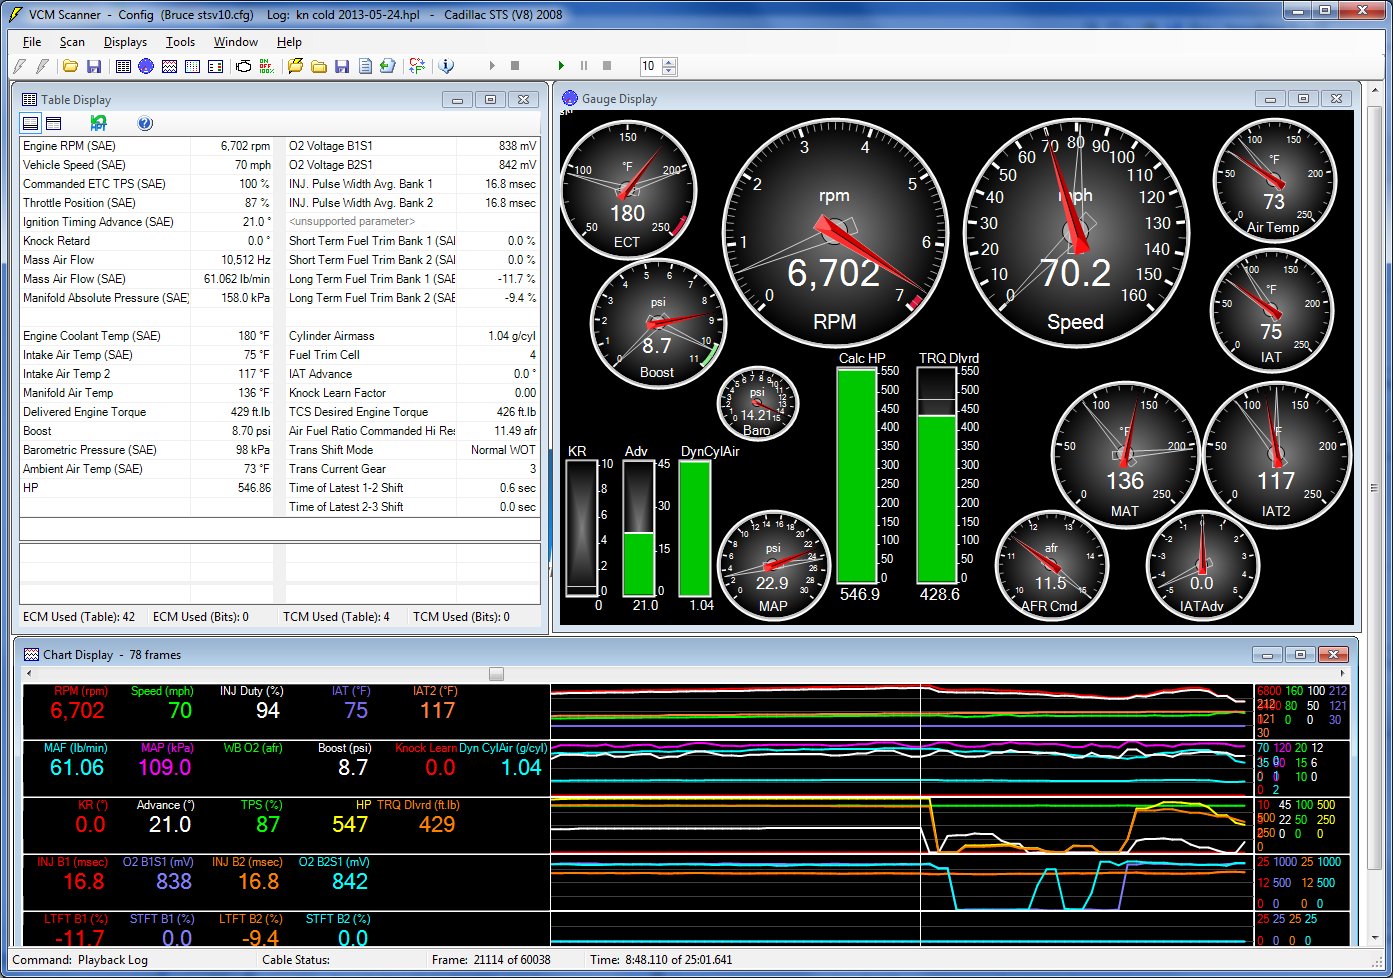
I am gathering more test information using HPTuners and Virtual Dyno on my 2008 Cadillac STS-V across different modifications.  Today’s runs with a full tank of gas and nice weather after an overnight rain.  HPTuners shows the baro that the engine perceives, so I am using that for baro adjustments.

KN cold 2013-05-25 2 run comparison with weird midtorque run adjusted

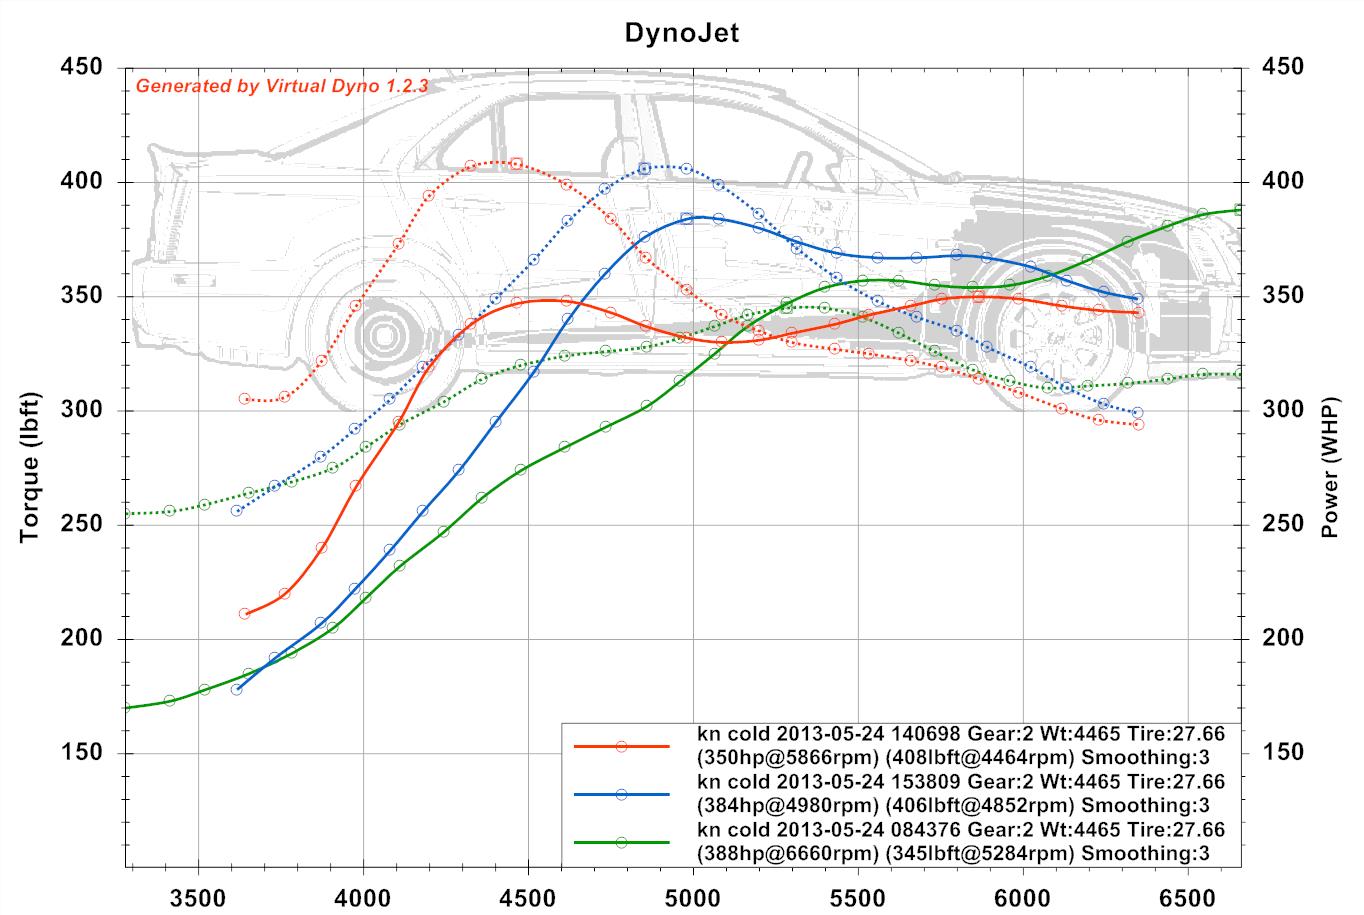
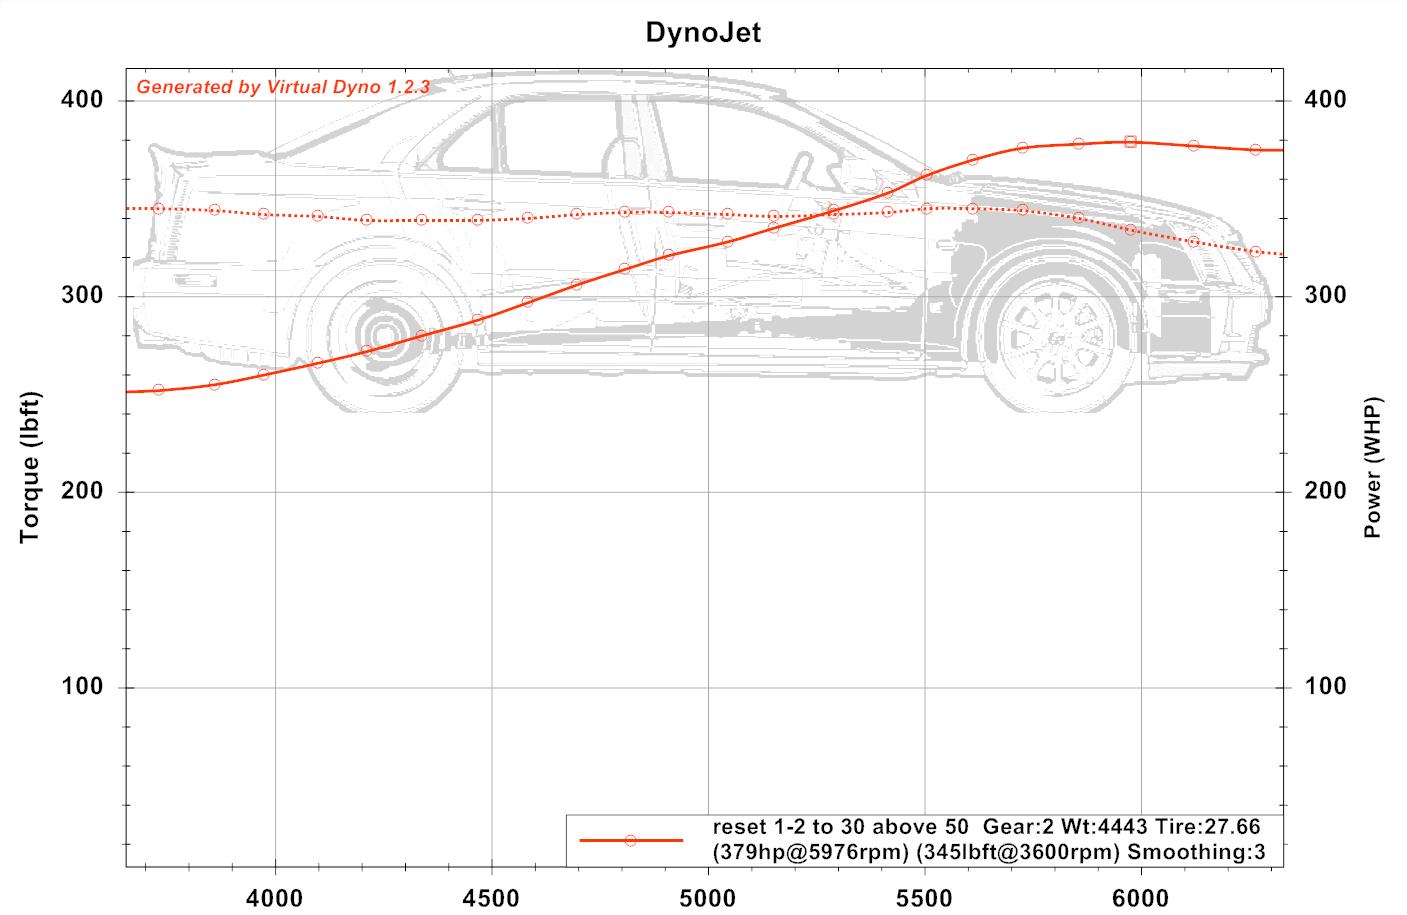
This morning’s run in red vs the previous odd run in blue.  Today’s run showed the expected shapes — high torque at low RPM, high HP at high RPM.  Huge torque reading at low RPM today.  Not sure what additional variables the automatic transmission might be tossing in — these runs are in TUTD (touch up, touch down) mode with 2nd gear manually selected.  I have also adjusted yesterday’s run to reflect that it was with lower fuel before I filled up today.

hptuners for kn cole 2013-05-25 1300203

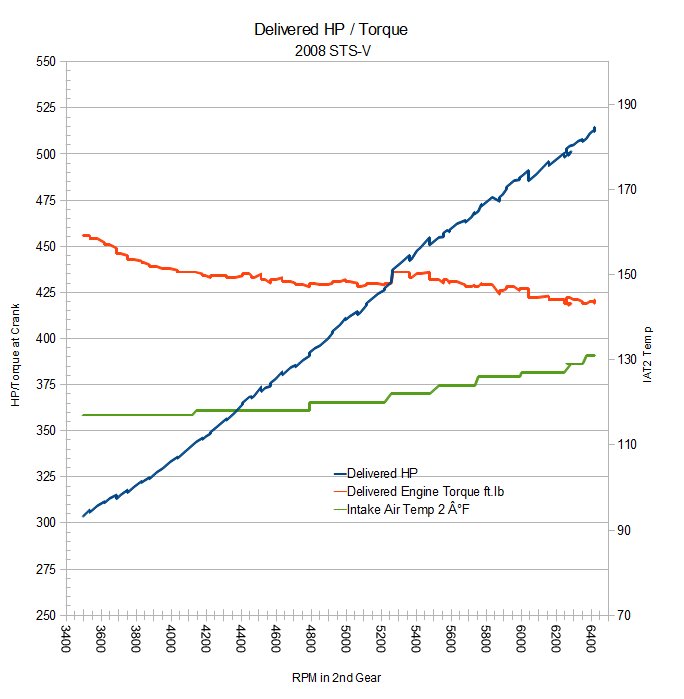
The Virtual Dyno is estimating wheel horsepower.  400 WHP with 20% drivetrain losses for an average automatic would equate to 500 hp at the crank.  HP Tuners estimated the engine was making 543+ hp at the crank for an instant at 6651 RPM, and above 520 from 6300 RPM on; 1- 400/520 hp  which would be a 23% drivetrain loss.  My goal for the STS-V was to get to a solid 400 WHP, which was reached with exhaust and CAI. Now I would like to get to a solid 425 WHP…

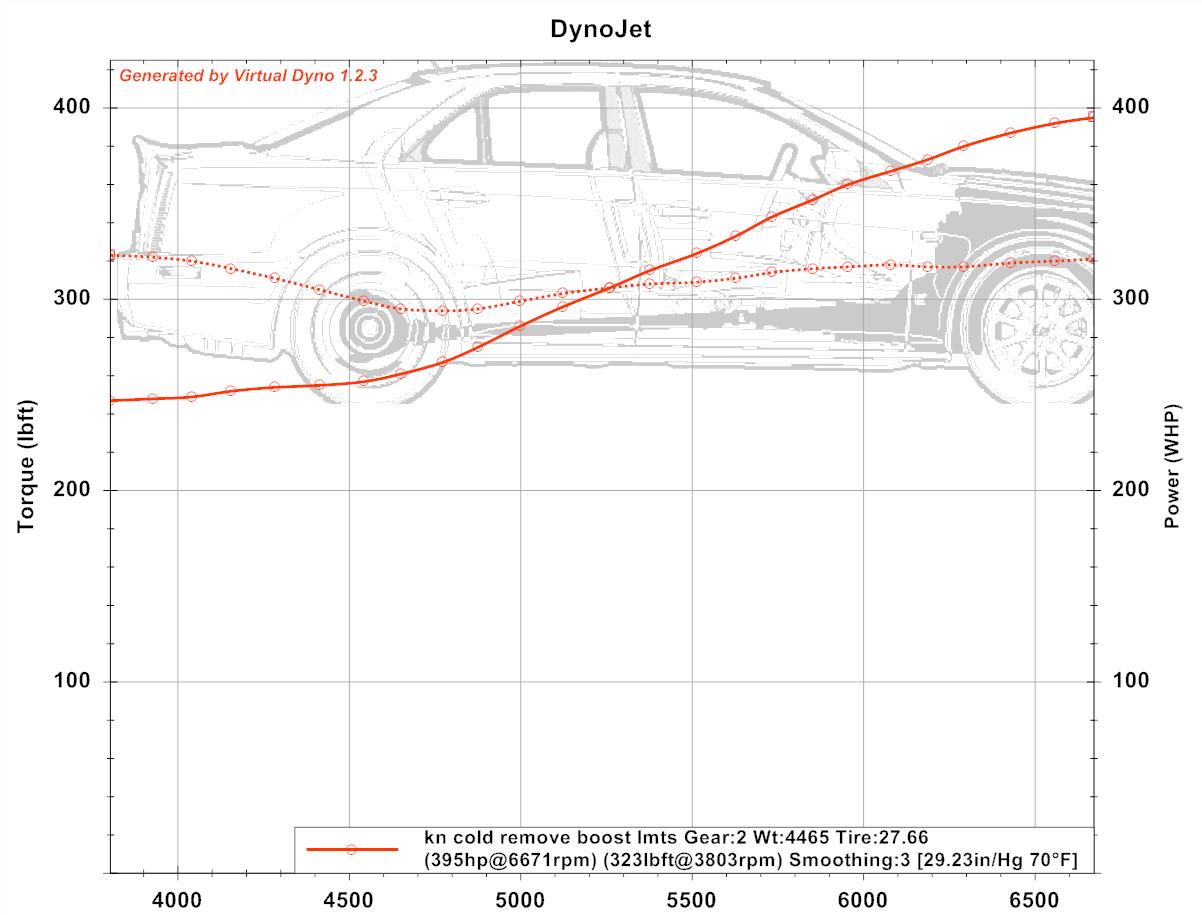
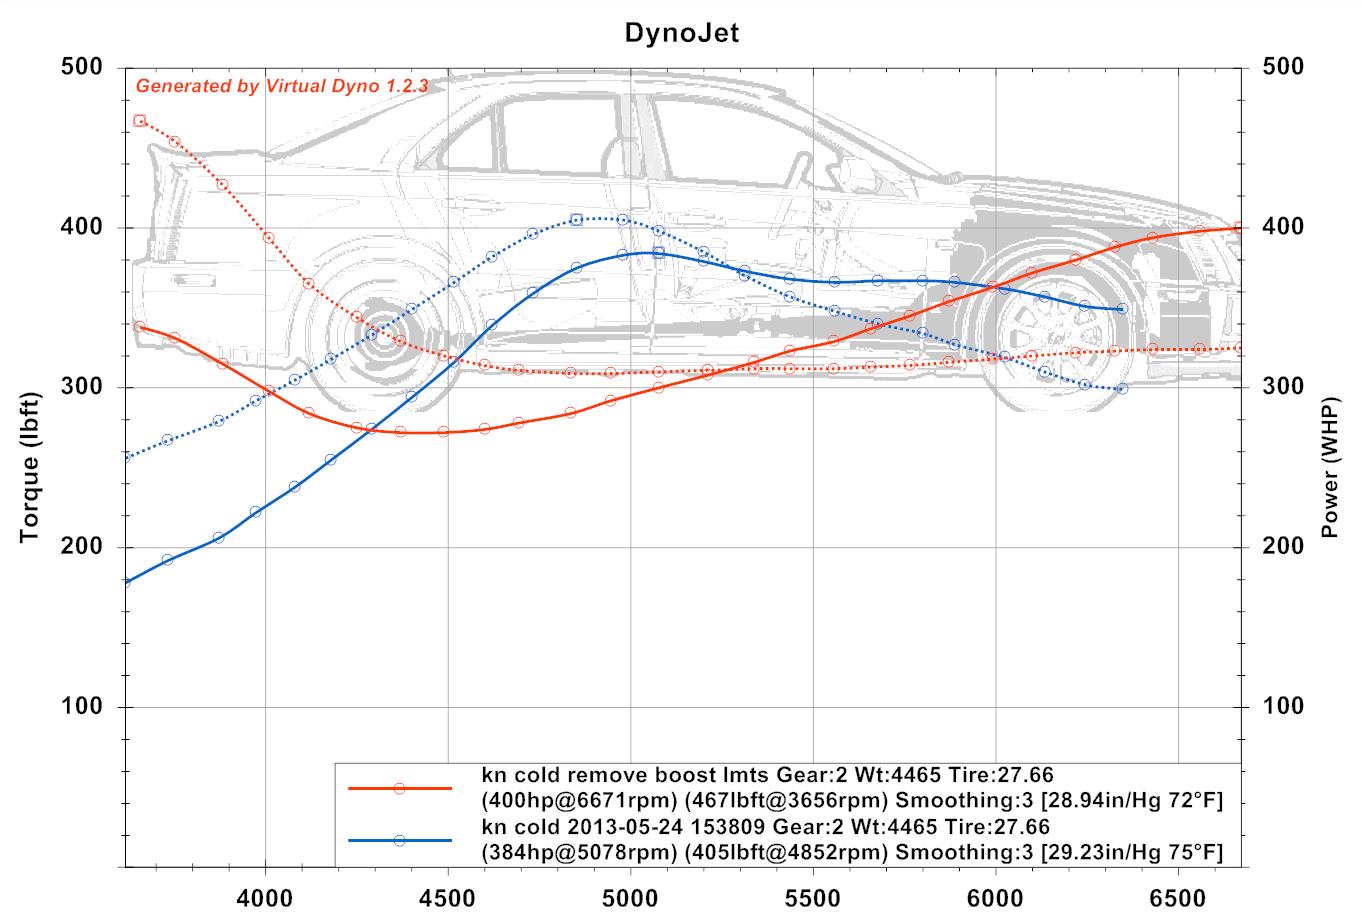
After the huge mid-RPM torque and low high HP run in the comparison above, I made an adjustment to ensure the engine wasn’t limiting boost.  In this theory, if the supercharger were breathing better and hit a higher boost point earlier than expected, the PCM might pull boost at high RPM.

Today’s run showed the engine is pulling and building boost all the way to fuel cutoff.  So either the previous odd run was just that, an odd dataset, or the new adjustments are working.

Here is a comparison of last night’s hot run vs today’s cold run:

kn cold 2013-05-25 comparison to kn hot 2013-05-24

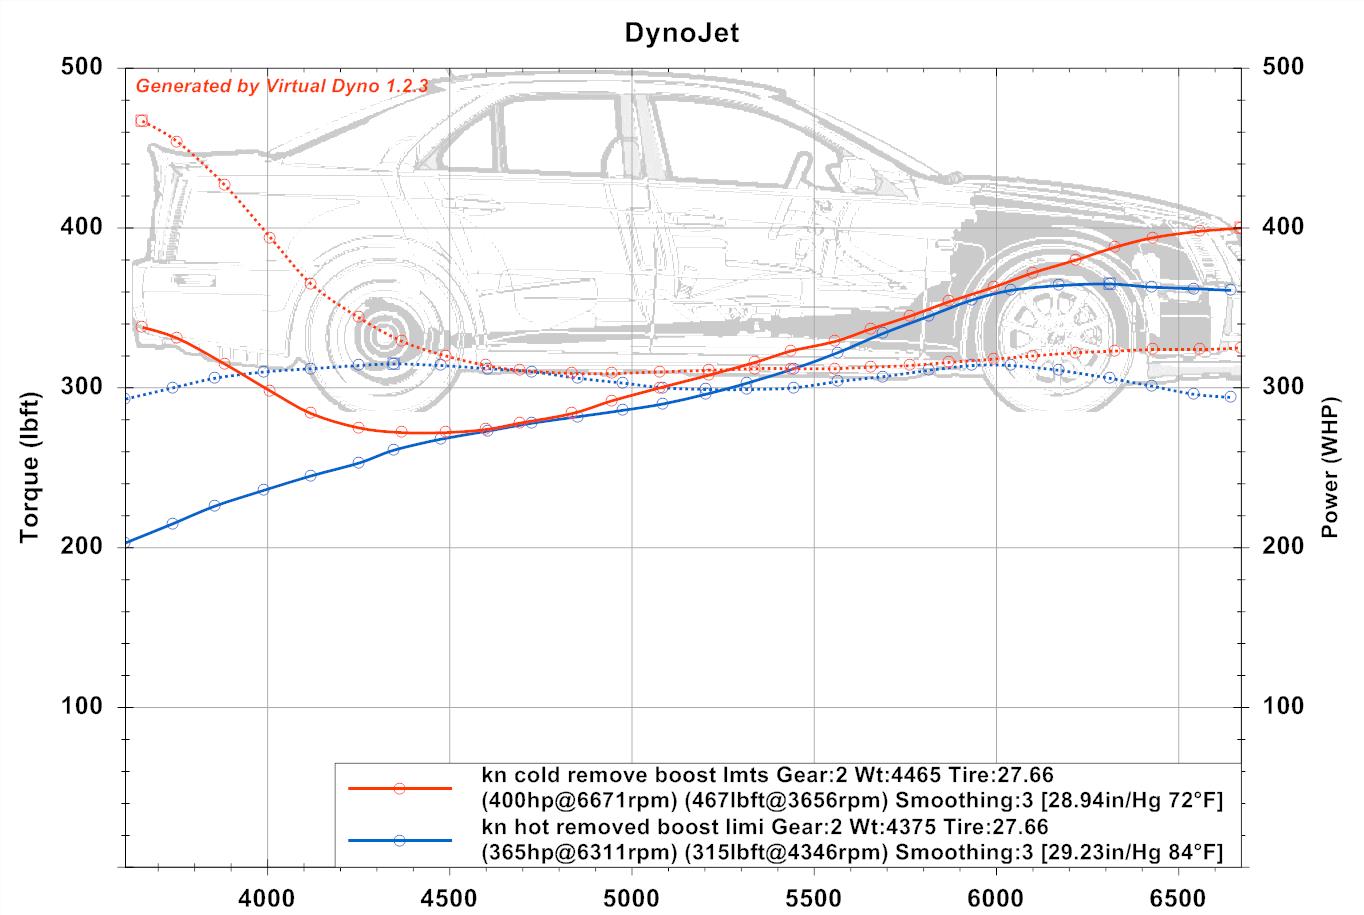
Both of these are adjusted for weight, barometer, and temperature per the SAE standard, so they should read identically (within the error of the method used).  However, my STS-V is effected by heat to a greater degree than the standard adjustments correct so even with adjustments hot reflects lower results than cold.  This has added a dimension to testing.
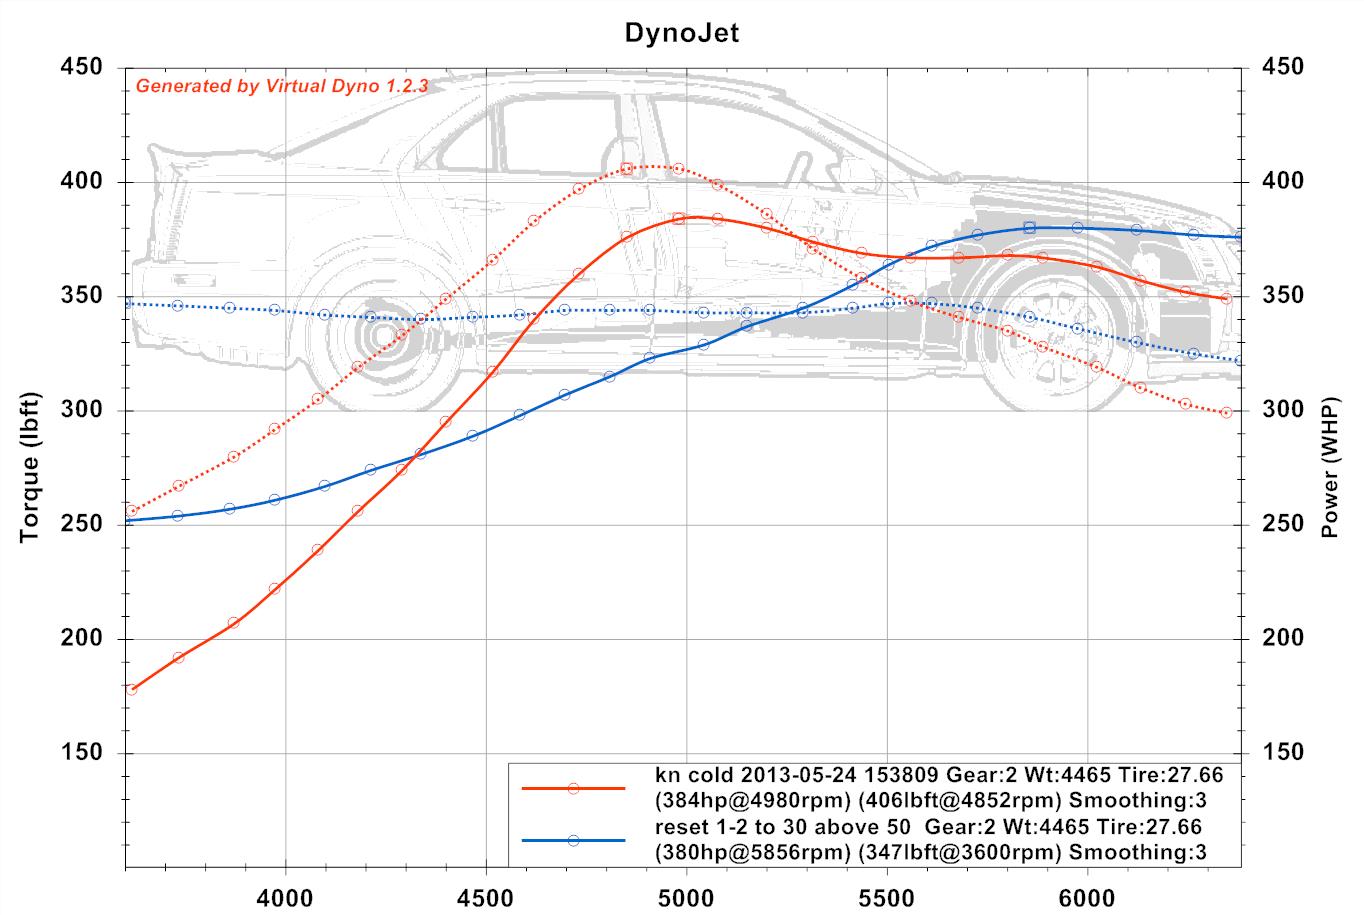
 

Update:

Today’s graph had some data noise at the beginning of the run that caused the high torque spike.  With that removed the updated graph below is correct for today:

KN 2013-05-25 Correction

Re-test of K&N filter on Spectre CAI with Virtual Dyno

This morning I ran some cold comparison tests for the K&N Filter in the Spectre CAI.

I changed my test method for these runs — same test route, but instead of starting from a stop, I started from a roll with the transmission manually selected to 2nd gear.  My thinking was that this would be less stress on the tires/drivetrain, and give better low rpm torque readings.

kn 2013-05-24 three run comparison cold locked 2nd pulls

The results are not what I expected.  We were looking for 376-380 whp so that part seems in range, with one runs at 384-388 whp.  The one run at 350 whp is odd.  The torque readings in general don’t seem to take the form one would expect.

kn 2013-05-24 hptuners

On the ‘green’ run in Virtual Dyno, I didn’t flip the transmission to auto-shift, so it redlined in 2nd gear getting to 6700+ rpm where the fuel cutoff is set.

Here is a similar graph with a previous 2nd gear sliced out of a 0-60 run compared with one of the runs from today:

kn 2013-05-24 cold to cold comparison

Red is today’s test; blue is a recent test in cool air with the Spectre filter in.  Today’s run appears to show much higher low end torque, and lower high end HP peak.

Next I will take the K&N filter off, check the installation, and re-install to see if there is something physical I am missing here.  Then I will re-oil the now cleaned Spectre and re-install it for testing.

Virtual Dyno vs HPTuners Delivered Torque Curve

Here is an Virtual Dyno analysis of a 2nd gear run up for my STS-V.  The Virtual Dyno considers the change in speed and estimates the hp & torque, much as a regular dyno.  The difference here is that the V is in 2nd gear and pushing against the wind.

2013-05-11 reset hot test

Virtual Dyno makes beautiful dyno graphs; one can get the full size by clicking on the image above, then hit return to return.

Here is the same info for the same run, graphed using the STS-V’s reported delivered torque and calculated hp for that torque, along with the IAT2 temps:

resetruncomparedeliveredhptorque

The Delivered Torque is an estimated value by the V computer based on engine parameters, and is equivalent to an engine dyno as opposed to a chassis dyno as in  Virtual Dyno.

Both show an item of interest and why I was graphing — the peak torque for the V is not up in the 5K’s but is still around 3500 RPM.  Certainly the torque curve is very flat for the supercharged V8.

Somewhat surprising how much the two disagree on the slope of the HP above 6000 RPM.  The transmission is already thinking about shifting to 3rd at that point, which could effect the incremental results measured by the Virtual Dyno more — the engine output doesn’t care if the engine is ‘clutched’ or not.

Do you have any suggestions on how to get more info out of this data?  I am using HPTuners to capture sensor data from a test drive, then saving as a .csv file, and using Virtual Dyno to analyze the .csv, or Calc to create the lower graphic from the .csv data.