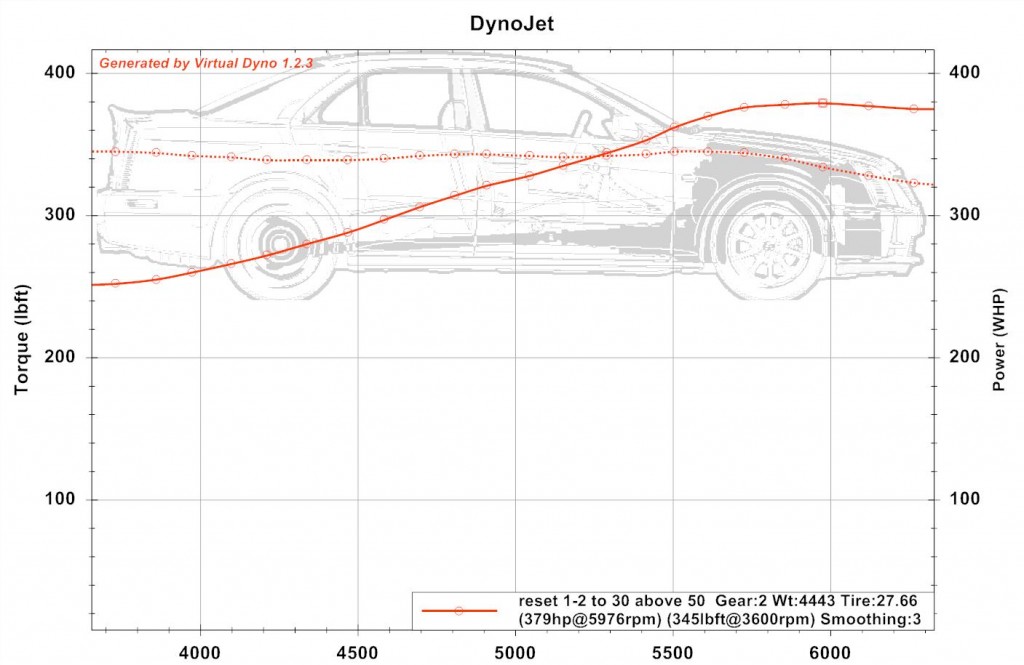
Here is an Virtual Dyno analysis of a 2nd gear run up for my STS-V. The Virtual Dyno considers the change in speed and estimates the hp & torque, much as a regular dyno. The difference here is that the V is in 2nd gear and pushing against the wind.
Virtual Dyno makes beautiful dyno graphs; one can get the full size by clicking on the image above, then hit return to return.
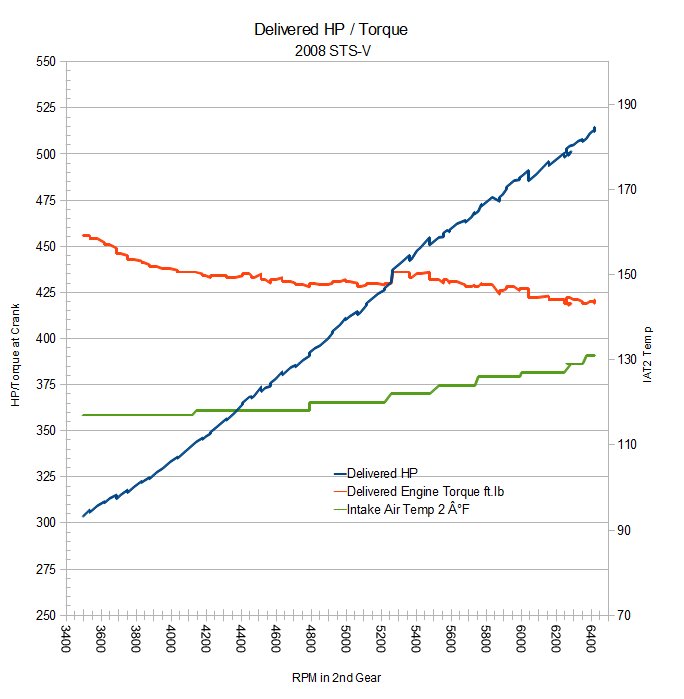
Here is the same info for the same run, graphed using the STS-V’s reported delivered torque and calculated hp for that torque, along with the IAT2 temps:
The Delivered Torque is an estimated value by the V computer based on engine parameters, and is equivalent to an engine dyno as opposed to a chassis dyno as in Virtual Dyno.
Both show an item of interest and why I was graphing — the peak torque for the V is not up in the 5K’s but is still around 3500 RPM. Certainly the torque curve is very flat for the supercharged V8.
Somewhat surprising how much the two disagree on the slope of the HP above 6000 RPM. The transmission is already thinking about shifting to 3rd at that point, which could effect the incremental results measured by the Virtual Dyno more — the engine output doesn’t care if the engine is ‘clutched’ or not.
Do you have any suggestions on how to get more info out of this data? I am using HPTuners to capture sensor data from a test drive, then saving as a .csv file, and using Virtual Dyno to analyze the .csv, or Calc to create the lower graphic from the .csv data.


Pingback: Air Ducting to CAI DIY Mod #Motorama - CaddyInfo - Cadillac Conversations Blog