Virtual Dyno building a sample set

Virtual Dyno is a program by Brad Barnhill that can be used to analyze the performance of your car based on a dyno-like presentation of data logs.  I discussed Virtual Dyno in more depth here.

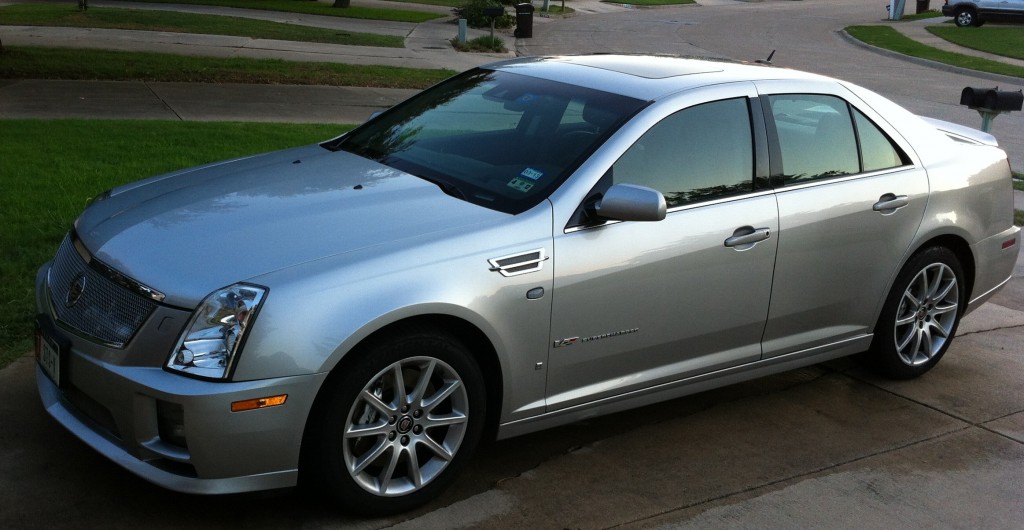
2008 Cadillac STS-V

2008 Cadillac STS-V

Today I captured 3 relatively controlled test runs over the same stretch of road with the goal of measuring repeatability.  It is important to control as many variables as possible in order to ensure the test is measuring what you think it is measuring.  All runs today for safety are in 2nd gear; on an actual dyno runs are done in the gear closest to 1:1, so 4th gear.

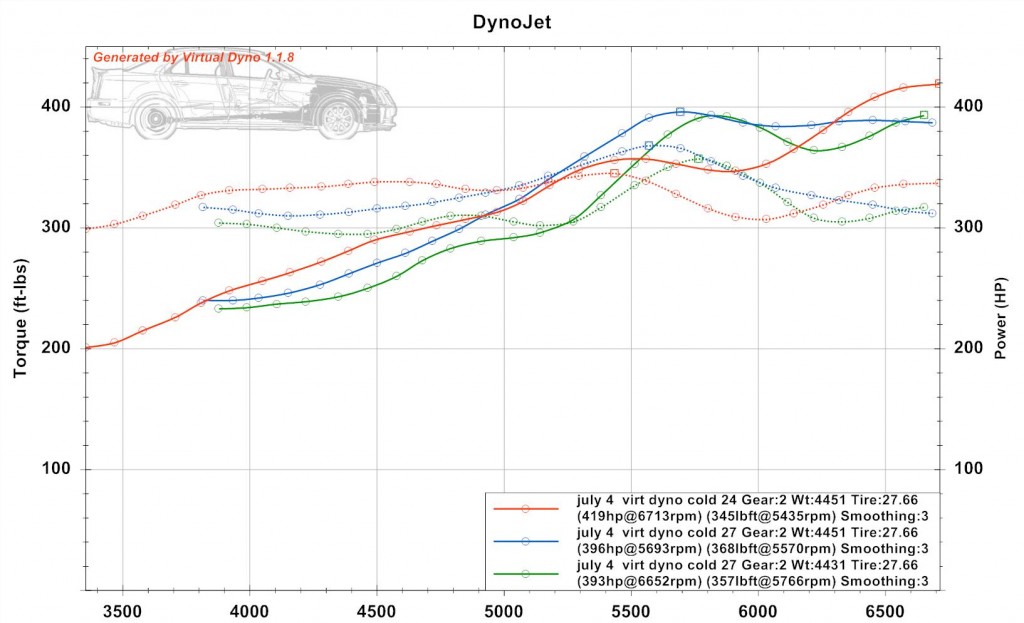
Virtual Dyno Cadillac STS-V

Virtual Dyno Cadillac STS-V [click to zoom, back to return]

What the graph shows is 3 test runs. Each test run is with the STS-V manually selected and locked in 2nd gear.  The runs are shown top to bottom in the sequence they occurred.  They range 393, 396, and 419 whp.

Note that this is a dyno-like estimate of power at the wheels — so divide by 0.8 for the average automatic, or perhaps a bit more for the STS-V 6 speed to account for drive-train losses to get to crank horsepower.  The 393/.8 = 491 crank hp, and the three in sequence would be 491, 495, and 524 hp.  My STS-V is factory rated at 469 hp but has intake and exhaust mods.

Still a bit of variance from 5500 rpm on; this may be a variable valve timing effect.  We also see that the first run in a set is often much higher than follow-on runs.  Not sure if this is an intercooler heat effect.

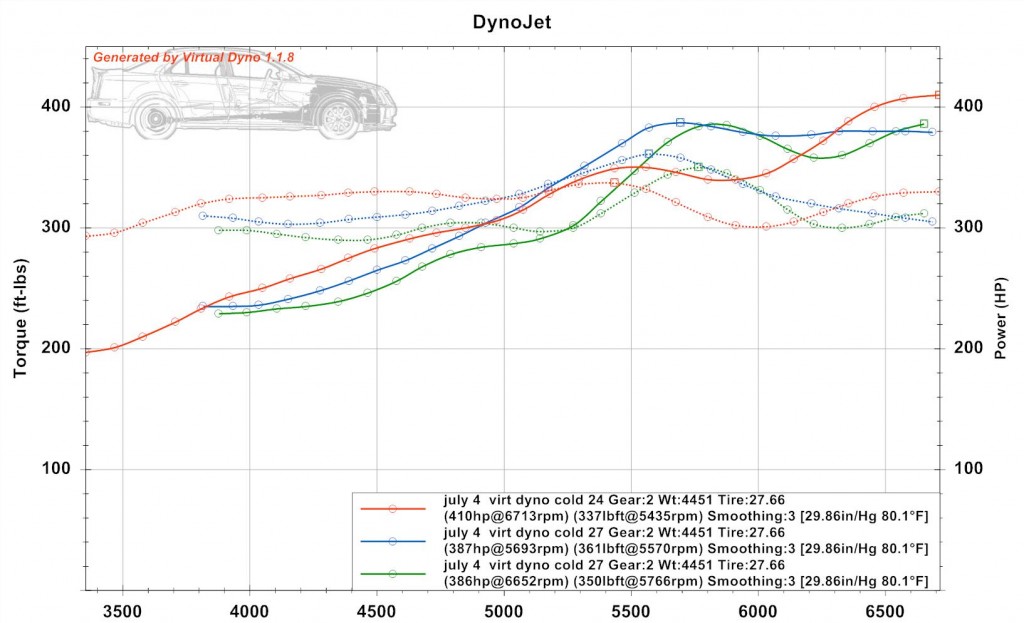
Virtual Dyno Cadillac STS-V SAE

Virtual Dyno Cadillac STS-V SAE [click to zoom, back to return]

To study the differences, I also put in the temperature and pressure for an “SAE” adjustment.  This reduced the results to 386 whp, 387 whp, and 410 whp.

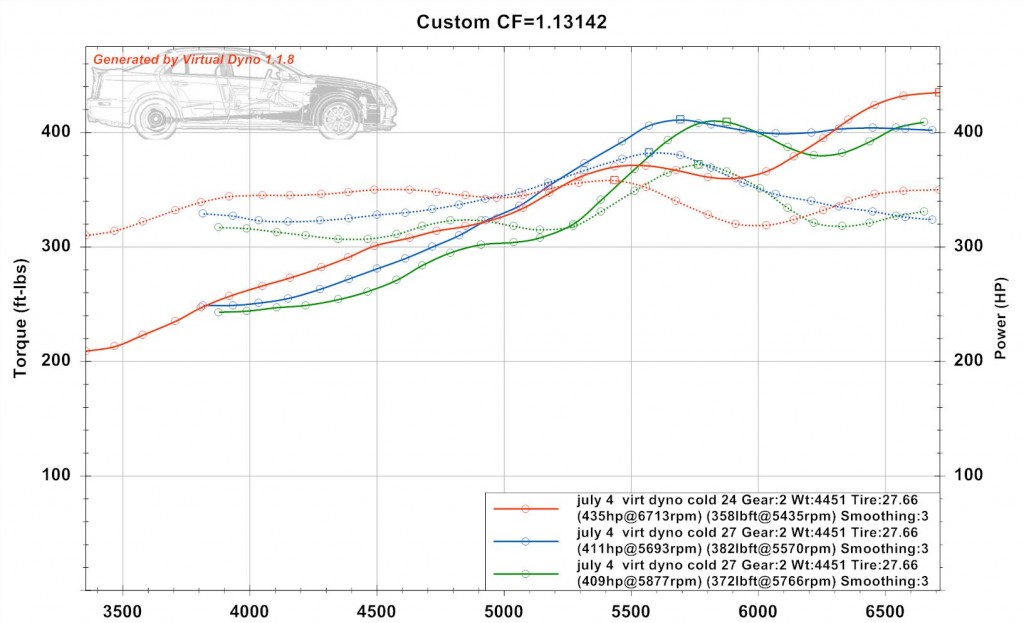
Virtual Dyno Cadillac STS-V Shelquist dyno adj

Virtual Dyno Cadillac STS-V Shelquist dyno adj [click to zoom, back to return]

Finally, to account for our local altitude I used the Shelquist Engineering calculator hereto get a dyno factor, and joined that dyno factor multiplicatively with the dynojet factor in Virtual Dyno.  (1.09 x 1.038 = 1.13142).  This raised the results at sea level to 409-435 whp.  This adjusted result is only useful for comparison to results from other regions which might be closer to sea level.

Virtual Dyno adjustments

From these choices I am inclined to use the SAE adjusted, which addresses temperature and pressure, but not adjust for altitude except if comparing runs from different locations.  I can note that runs are at our 600 feet altitude.

HPTuners Gauges Cadillac STS-V First Run Peak HP

HPTuners Gauges Cadillac STS-V First Run Peak HP

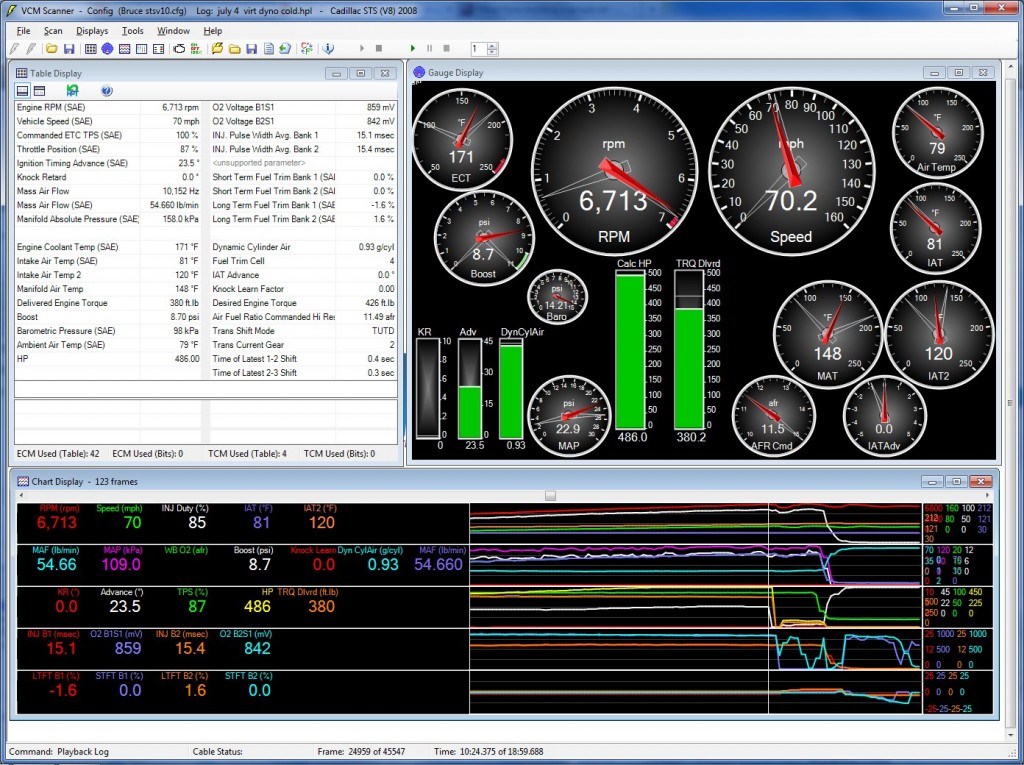
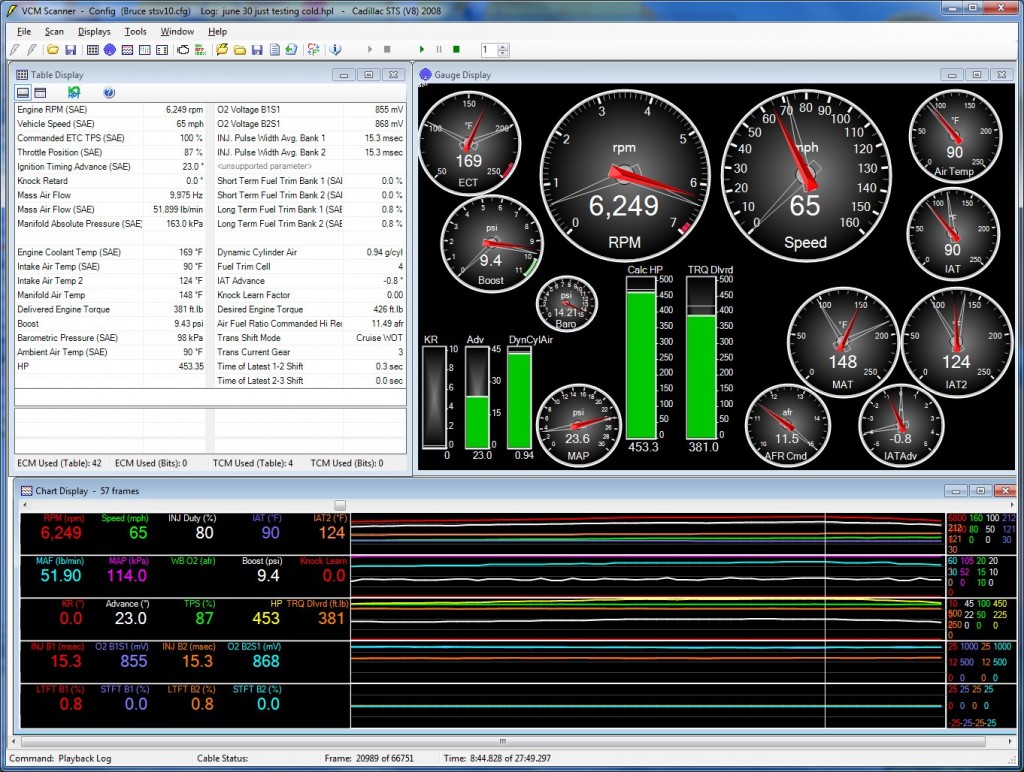
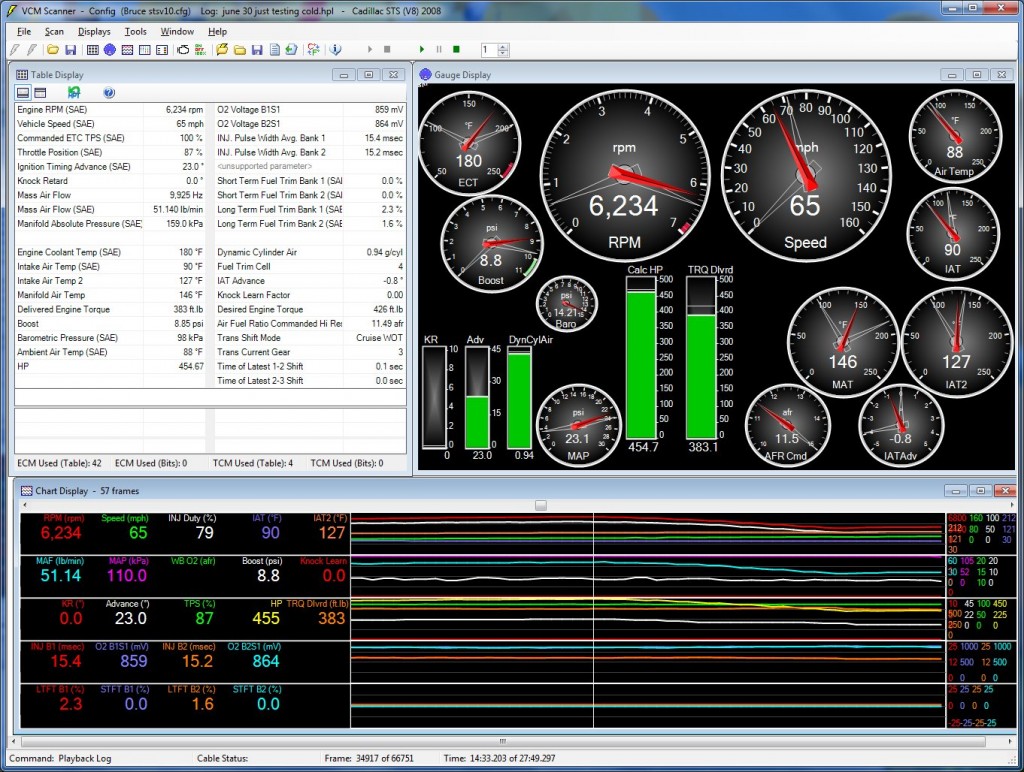
This is a screen capture of the HP Tuners gauge set for the first run at HP peak.  These were what I call ‘cold’ runs — with the STS-V at temperature but not heat soaked as I do for testing the intercooler cooling system.

July 4 with 3 runs second run Hptuners

July 4 with 3 runs second run Hptuners

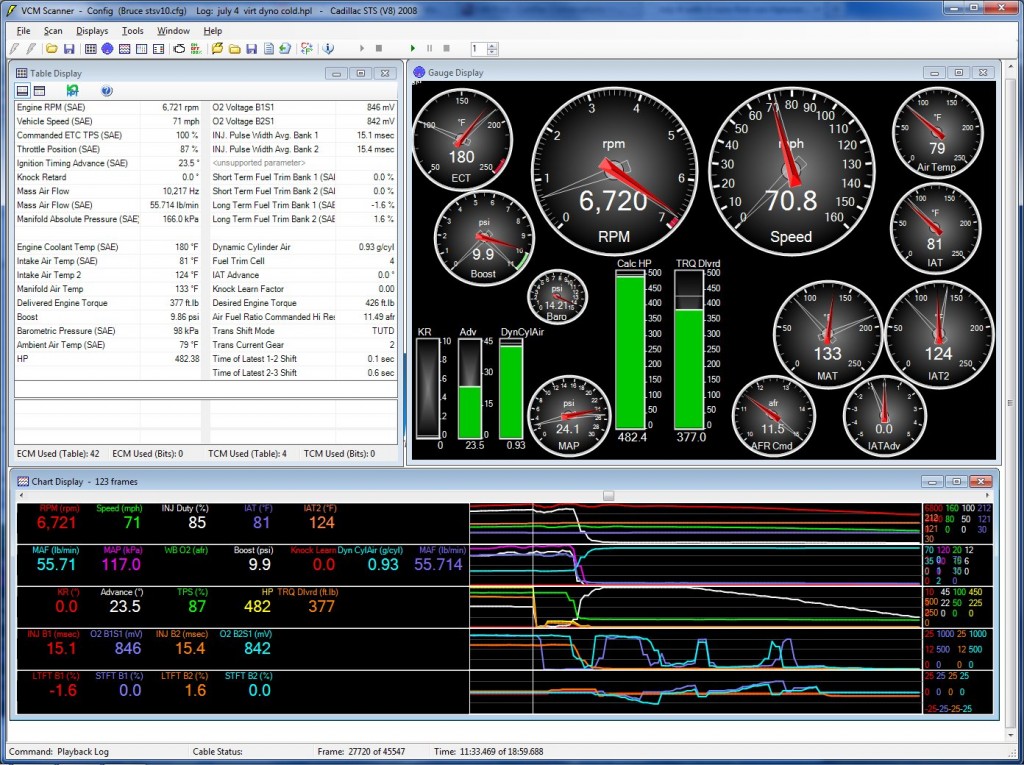
This is the gauge snapshot for the second run.  There was a difference of 9F in the engine coolant temperature between the runs.

Virtual Dyno Conclusions

The Cadillac STS-V appears to be performing well in these tests.  The tests suggest it is running 386-410 whp, which using 20% losses is 482-512 hp.

The tests didn’t cost me anything but gas and time, and could be done at my choice of times.

With the intake and exhaust changes, the STS-V makes power all the way up to 6,700 rpm.

Obviously I want to look for variables that will cut this range of same-day, same road results.  I plan to continue collecting data runs and try to characterize the results further.

Virtual Dyno by Brad Barnhill Review

Virtual Dyno by Brad Barnhill is a stand-alone software program that analyzes and presents data captures in the form of a virtual dyno graph.  It can work with a variety of datalogging formats.

I have been interested in Virtual Dyno and have read a bit about it.  Today made a good day to grab several data runs, slice them up, and compare.

Virtual Dyno data capture

I used my normal 20 minute test drive route.  I ensured that I added several 2nd gear pulls from 30 mph to 60+ mph, as I wanted to check that range at the top of 2nd gear.  I am unfortunately far from Mexico, where all true internet speed captures are done (lol), so a true 4th gear pull to 144+ mph is not in the cards today.

Virtual Dyno data preparation

To capture the data, I used HP Tuners VCM Scanner.  I exported the data file with all runs to a .csv comma delimited file.  I used VCM Scanner gauge review to find the 0-60 runs and noted the sample range for each run.  Then I used Open Office Calc to edit the .csv file, creating new .csv files with only the acceleration run of interest in the .csv file.  I renumbered the sample for each run from 1..n within that file, and named the file by the sample file name and sample range.

Although Virtual Dyno includes a file for the STS-V, it treats them as if the weight were constant for all model years, although it was not. The correct weights are 4,343 lb in 2006, 4,295 lbs in 2007, and 4,233 lbs in 08/09.  I created a custom file in the app data section for the 08 STS-V.

in addition, my STS-V has an extra inline intercooler tank (12 lb with coolant) and a ZZP front mounted heat exchanger (6.4 lbs). So my curb weight would be 4,251.

Today my car was at 1/2 fuel, so 9×6=54 lbs of fuel missing; 4251-53=4199 lbs.

Virtual Dyno screen shot

Virtual Dyno Screen Shot [click to zoom, back to return]

Virtual Dyno includes a few different dyno settings and adjustments.  Since my actual dyno was done on a dynojet I selected it.

Virtual Dyno Screen Shot

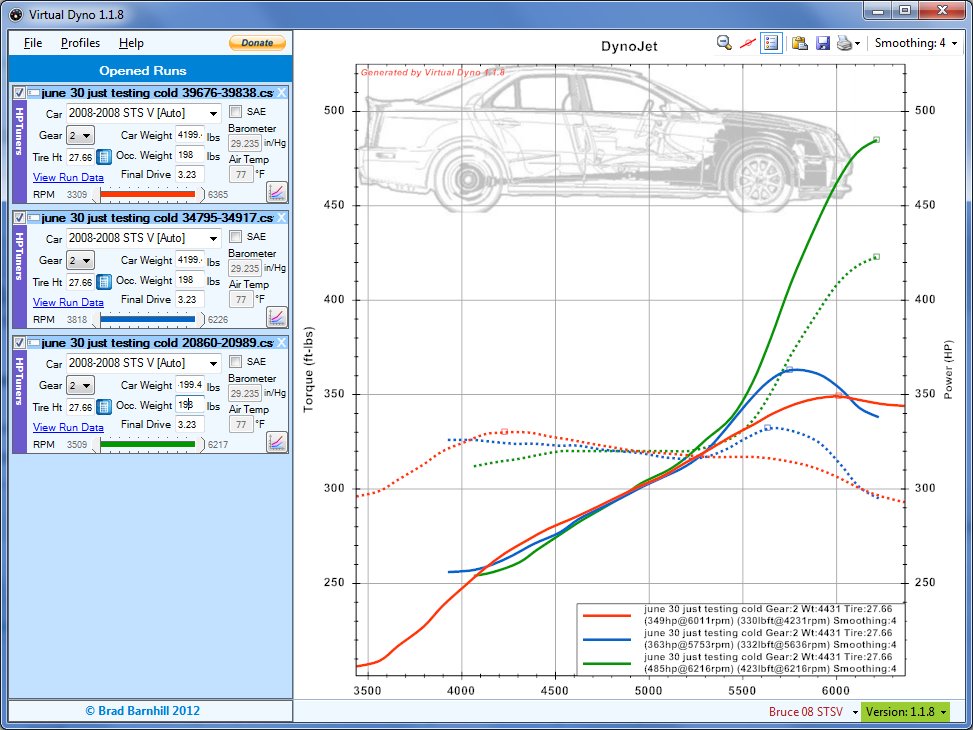
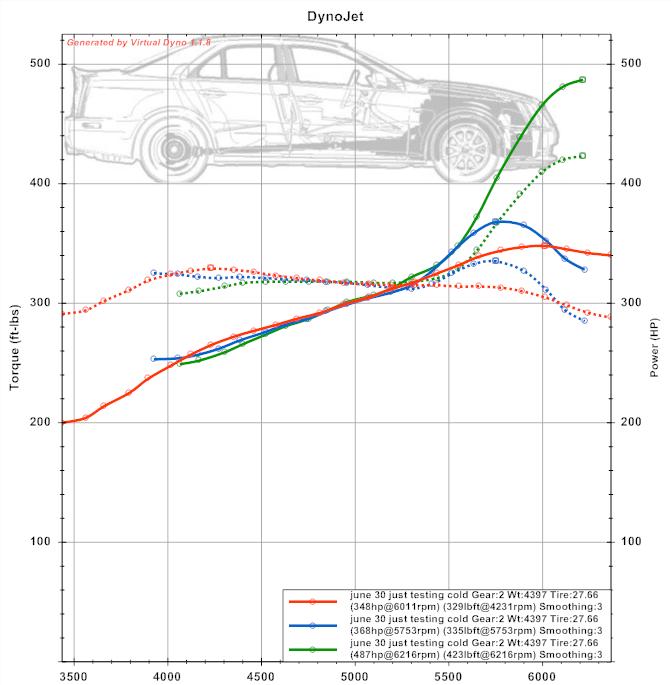
This screen capture shows Virtual Dyno crunching 3 different datalog runs from the same day. The data run file info is shown to the left, and the data runs are graphed to the right.

I wanted to compare them side by side to decide repeatability.  With many modern cars this in itself is troublesome — my 2008 Cadillac STS-V will tend to run quite differently from one run to the next.  So determining what variability is due to the software and what variability is due to the vehicle performance is tricky.

Virtual Dyno Graph

Virtual Dyno Summary

Virtual Dyno exports the graphic output into an image file, which makes it easy to use and reference.  What my runs seem to show is that the first run, while the STS-V was up to temperature, but still relatively cool, the V made the most power at 485 whp.

The other 2 runs had relatively more wheelspin, and made relatively less power, at 363 and 349 whp, although within a relatively close range of each other.

Here is the HPTuners Gauge output for the max hp run:

Virtual Dyno comparative HPTuners Gauge Output

Virtual Dyno comparative HPTuners Gauge Output [click to zoom, back to return]

Hot on the dyno before the cooling additions my STS-V made 394 whp on a dynojet dyno in 4th gear.  Assuming the virtual dyno is setup properly and interpreting the data presented, what we may see here is that there is a lot of variability in the power the STS-V produces.  Even with traction off, a lot of wheelspin in 1 causes early shift to 2nd and a longer pull with the intake temps heating up, and power reduced.

HPTuners Gauge snapshot for the lower HP [blue] run:

Virtual Dyno HP Tuners Snapshot

Virtual Dyno HP Tuners Snapshot [click to zoom in, back to return]

Virtual Dyno Smoothing 3

Virtual Dyno Smoothing 3

Virtual Dyno Smoothing

Virtual Dyno offers a range of smoothing.  Smoothing is averaging of the values relative to their surrounding values.  It has the effect of better showing average or trend information out of relatively bumpy real life data.  A smoothing choice that shows smooth data trend lines but no more than needed seems best — and consistent from run to run and day-to-day.  The upper graph has smoothing 4; the lower graph has smoothing 3.  I plan to stick with Smoothing 3.

Virtual Dyno — What does it all mean?

Virtual Dyno gives you another input to try to measure how your vehicle is performing.  It has the advantage that you can use it on the street at your leisure.  It has the disadvantage that you have to exercise more care to isolate and eliminate variables in your test method.  Otherwise you won’t have comparable tests from one day to the next.  As software I find Virtual Dyno easy to use and pretty consistent.    It is another tool in my toolbox of car metrics.  I will continue to work on repeatability.

Initial IAT2 times with New HX – woops

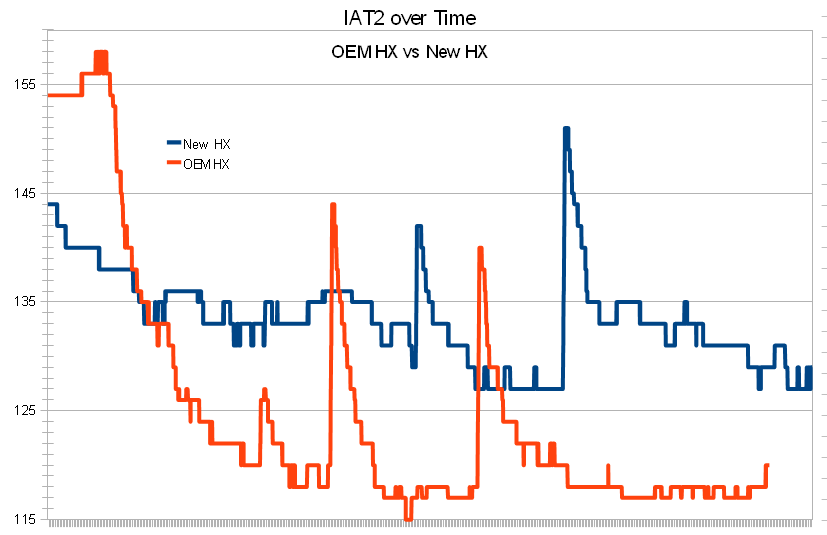
Initial IAT2 trends with the new Intercooler Heat Exchanger appear to be somewhat worse than the OEM intercooler heat exchanger.

This is disappointing since tuners have reported improvements with similar heat exchangers.  There may be more variables at play here, but my first tests suggest the new HX as installed is not performing better than the OEM HX.

To compare the two I considered HP Tuners VCM Scanner data captures for the OEM heat exchanger on a hot day (heat soaked) to a similar run with my replacement heat exchanger (a flexalite 45321).  IAT1 temps, which is air at the MAF, were similar for each run, but the runs were certainly on different days etc.  Thanks to HP Tuners for updating their comma delimited export capability to make this easier!

The first chart shows overall trend over time for my normal data capture run.  The spikes are acceleration runs.  The X axis is actually the sample time for the scan, which runs from 0-65K so I simply left it off for clarity.  The Y axis is IAT2 temps in degrees F.


The new HX appears to reach constant IAT2 around 127F.  The OEM HX reached constant IAT2 around 117F.

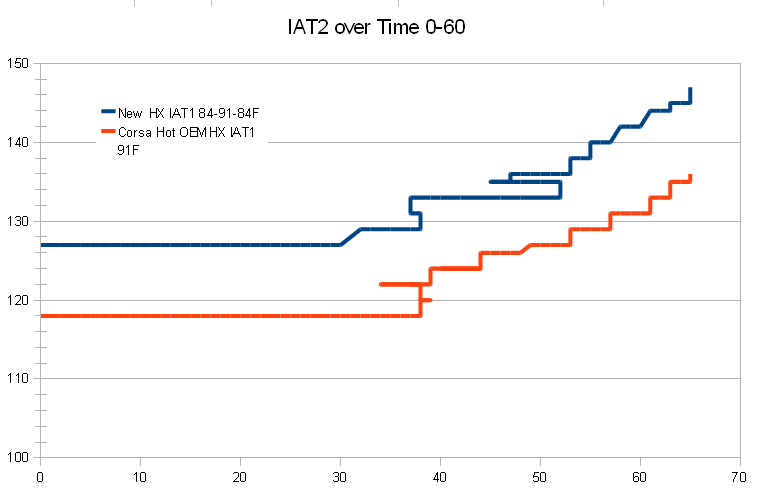
This is a comparison side by side over time during a 0-60 mph run with each:

The OEM HX starts at a lower temp, but the two HX’s appear to show similar trends for the expected increase in IAT2’s during hard acceleration.

It is possible that the system is still not air-free, and I will retest after a week of continued monitoring.