Cadillac XLR LH2 Tuning — Tune 6F Mixed MAF recal

Today’s Tune 6F uses the High Baro MAF calibration from 6B except from 4200-5200 rpm, where it pulls the air fuel ratio slightly (2%) richer.  What I hoped to see is a very flat air fuel ratio in the NBO2s, because that’s what we are commanding in the PE (12.5 AFR or 1.176).

The test setup had another freeze ahead of the test.  This time at least the XLR didn’t tilt, and after a few stop, turn the engine off, reassemble all connectors, restart the software, it started scanning again.

My prediction was that we would see the same result as Tune 6B, with better support from 4200-5200 RPM due to no fueling dip there.  Overall the result was not what I expected, but then, I’ve come to expect that.

XLR Tune 6F Mixed Maf

The red line is Tune 6B.  The ONLY difference between Tune 6B and Tune 6F is 4200-5200 rpm.  So the fact that Tune 6F comes to 4000 RPM 13 whp behind is a mystery (different days, different conditions, etc).  From 4200-5200 Tune 6E does well enough, but missing the tuned-in VVT hump at 5500 rpm.  Tune 6B does better from 6000+ rpm (but they are exactly the same out there!)
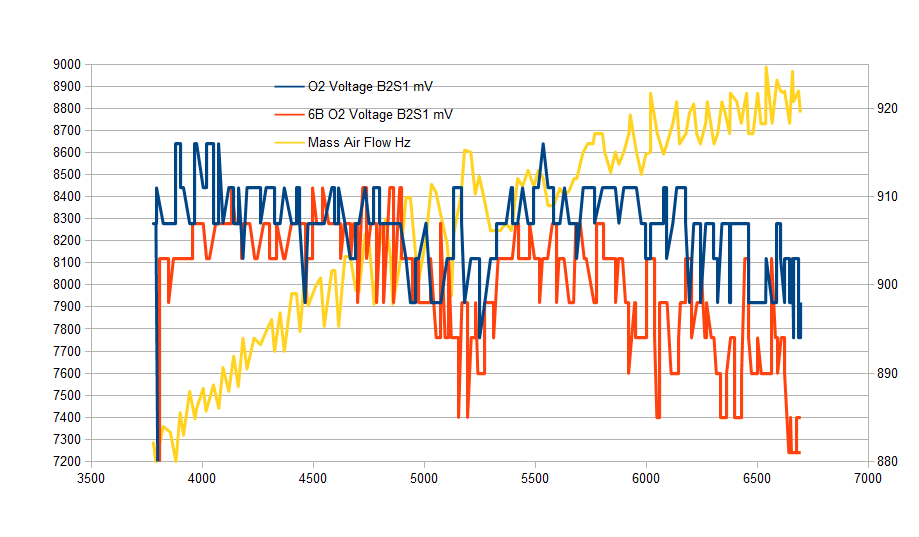
XLR Tune 6F AFR vs MAF Freq

This graph shows the narrow band trend for AFR for Tune 6F in blue, 6B in red.  I think the blue is much flatter, which was the goal for the test.  I included the MAF frequencies in yellow so I could easily relate the various regions to the way the MAF calibration works in the tuning tables.  Something odd happens to the air flow at 5200 rpm or so on both.

Again, the AFR is commanded flat from 4000-6800 RPM so I am calibrating the MAF to drive the blue line flat across the graph (ignoring the noise in the line).

XLR Tune 6F hptuners

Hptuners result showing max calculated HP for conditions for 6F.

XLR Tune 6B max HP b

Similar data for Tune 6B at max hp for that run.

In summary, good that the MAF calibration changes drove a more consistent AFR.  Again, not sure why I am seeing large day to day changes, except of course different days, different conditions, etc.  Perhaps every test needs to be Run Tune A, stop, recalibrate, Run Tune B, then compare.  That way they are on the same day, more or less similar conditions, etc.   Virtual Dyno does try to correct for baro and temp, but still seeing some variances creep into the tests.

UPDATE

After consideration, I believe part of the variability I am seeing is that Virtual Dyno corrects for baro and temp but not for humidity/dewpoint.   46% humidity (like today here) can double the dyno correction factor vs dry air.
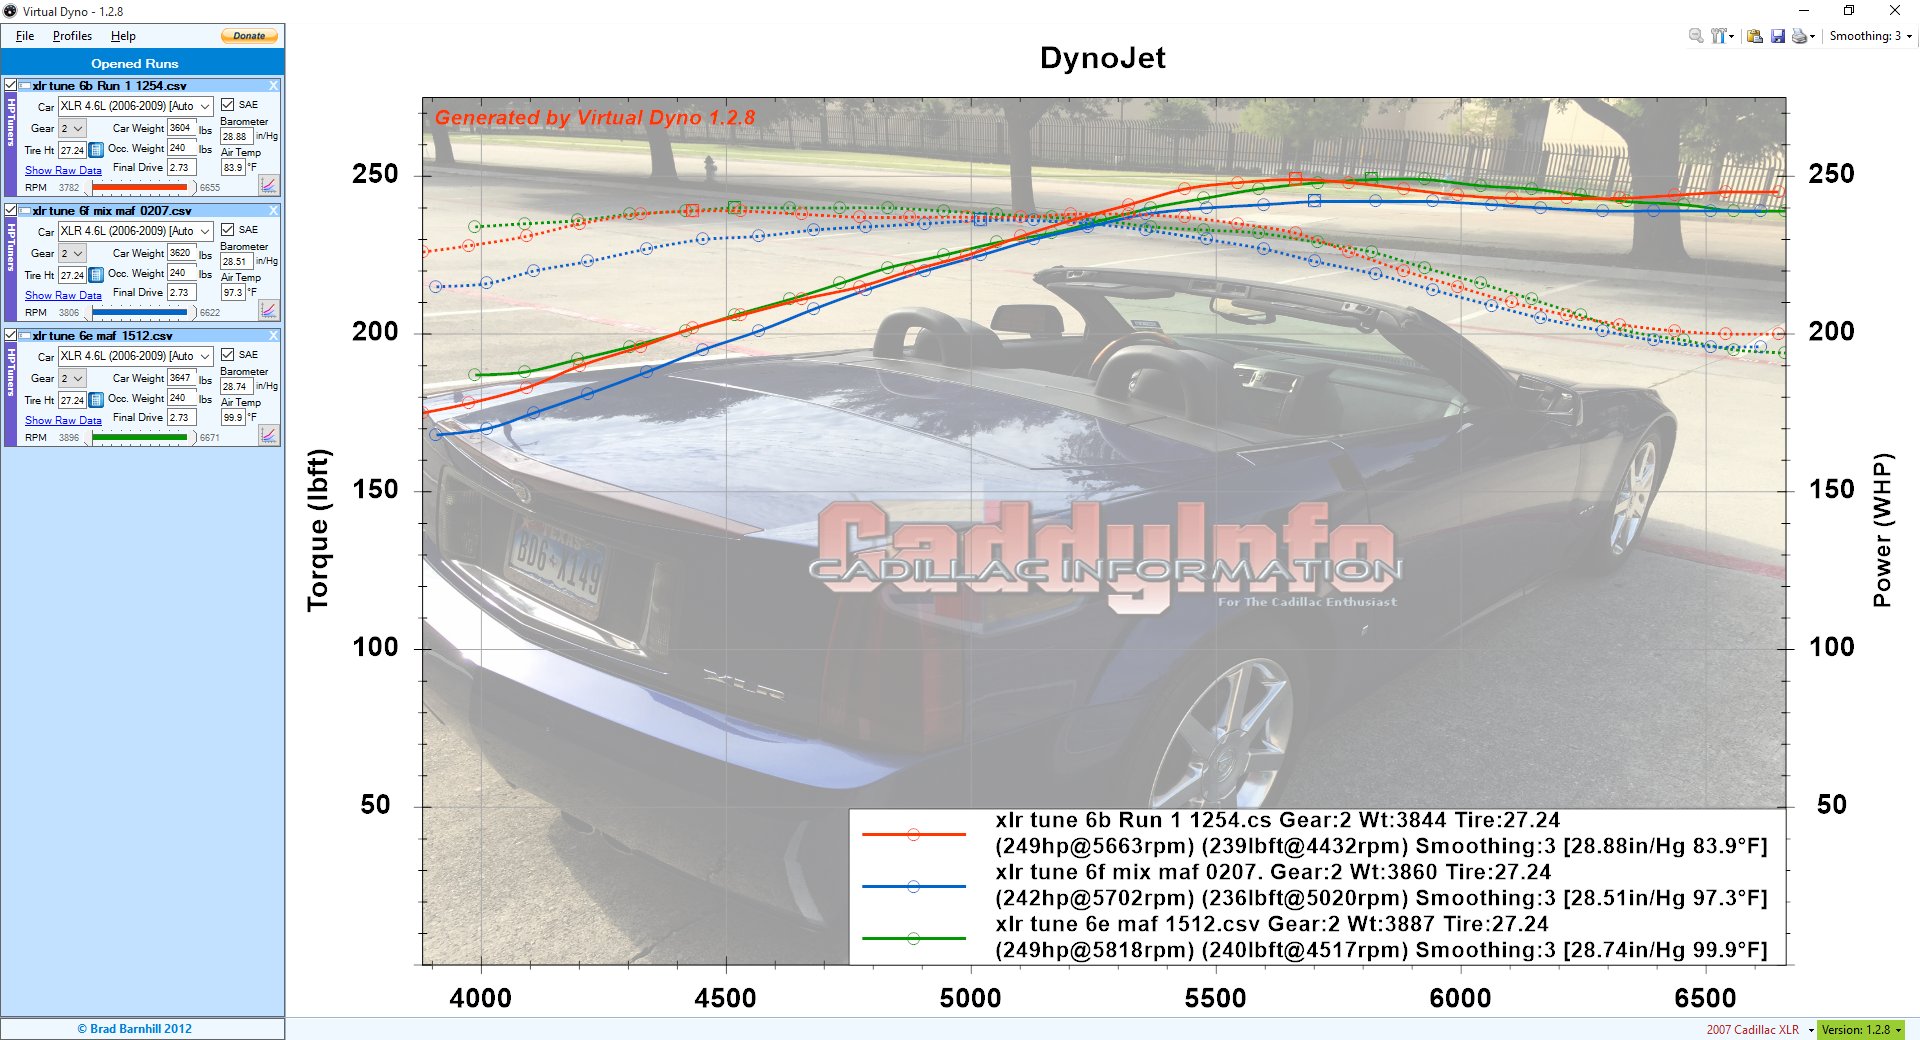
xlr tune 6F comparison humidity corrected

I plan to return to a process of using a calculator to correct for altitude, dewpoint, and humidity to arrive at absolute pressure and temperature for dry air, then put those values into Virtual Dyno for each run.  That will eliminate another source of variation.

UPDATE 2:

After some comparisons I see that if I put in adjusted pressure in dry air and test temp (as opposed to dry air temp) then I get almost the same multiplier as suggested by the dyno adjustment, within 0.1%
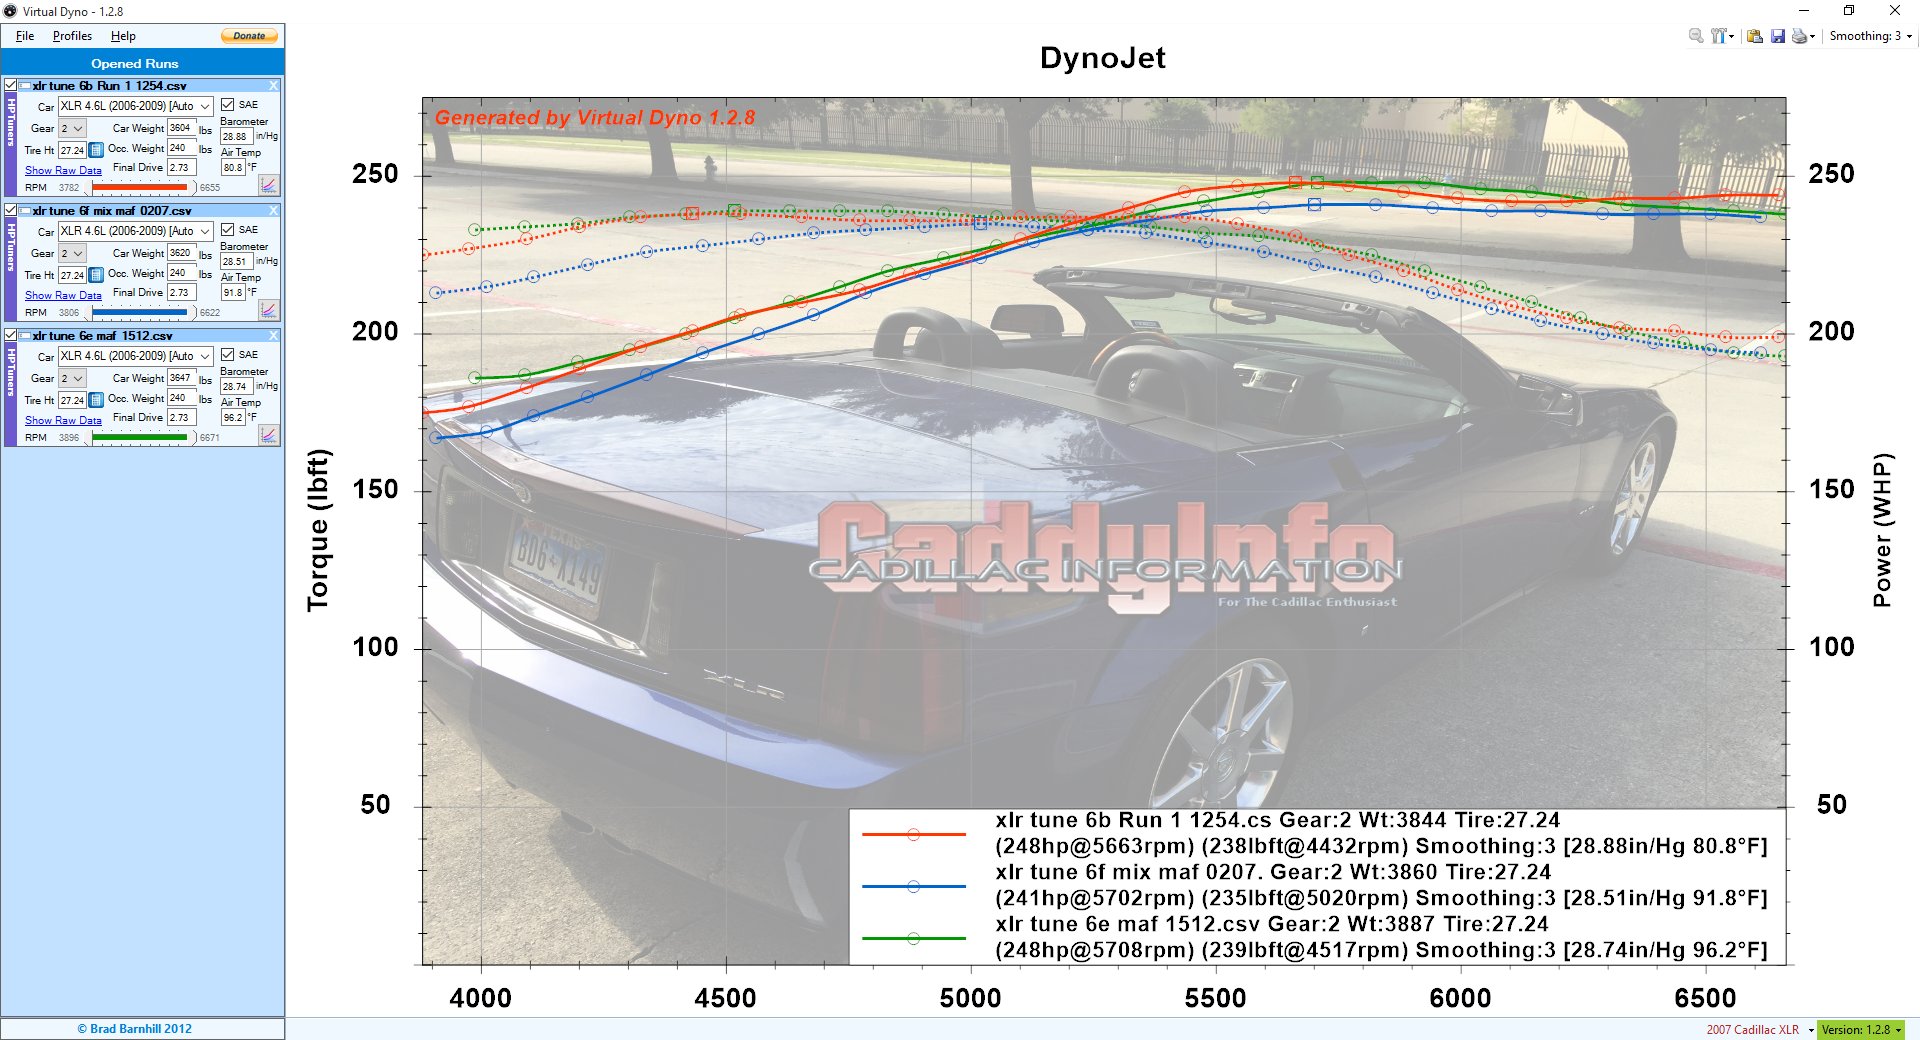
XLR Tune 6F comparison corrected

So this is my new plan on how to input baro and temp for Virtual Dyno.  This still leaves Tune 6F below the prior runs, but I will get more samples and see if this one was an outlier or we learn more.


Cadillac XLR Tune 5: Back to Basics, Glitches and All

If you are not getting the results you expect, reset and try again.  Today I moved to Tune 5, which is the OEM calibration with only changes to TUTD shift, top speed, and MAF calibration for the Volant.  No AFR baseline changes, no stoich, no timing changes.

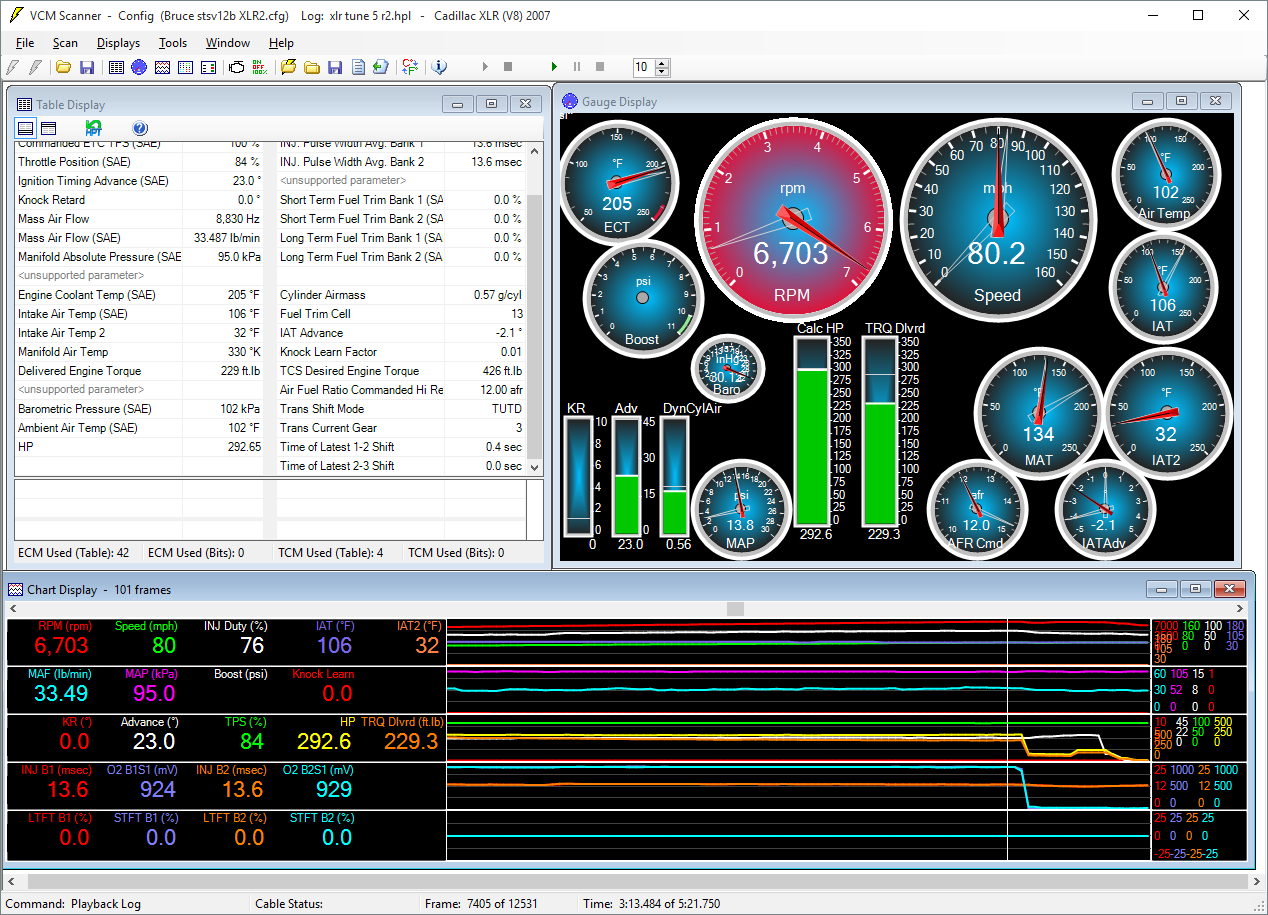
During the test run I was very disappointed to see the calculated HP only topped out at 200 hp or so.  Then I realized the VCM scanner had crashed along the way due to some laptop or scanning glitch.  I reset the scanner, and checked the cables and the hptuners interface. Then the XLR crashed – hard.  Every system reported with beeping and dinging and flashing and attention getting displays that it was not happy.  At that point the scanner would not connect to the car, the car was having a crisis, and I was quite concerned.

I share this with you so if you are ever busy testing this or that and everything goes to heck in a hand-basket, you know that’s a regular thing.

Eventually through some combination of resetting all the hardware including the XLR I was able to get the scanner to talk to the XLR, clear all DTCs, and properly scan for outputs again.  Then I went back to testing.

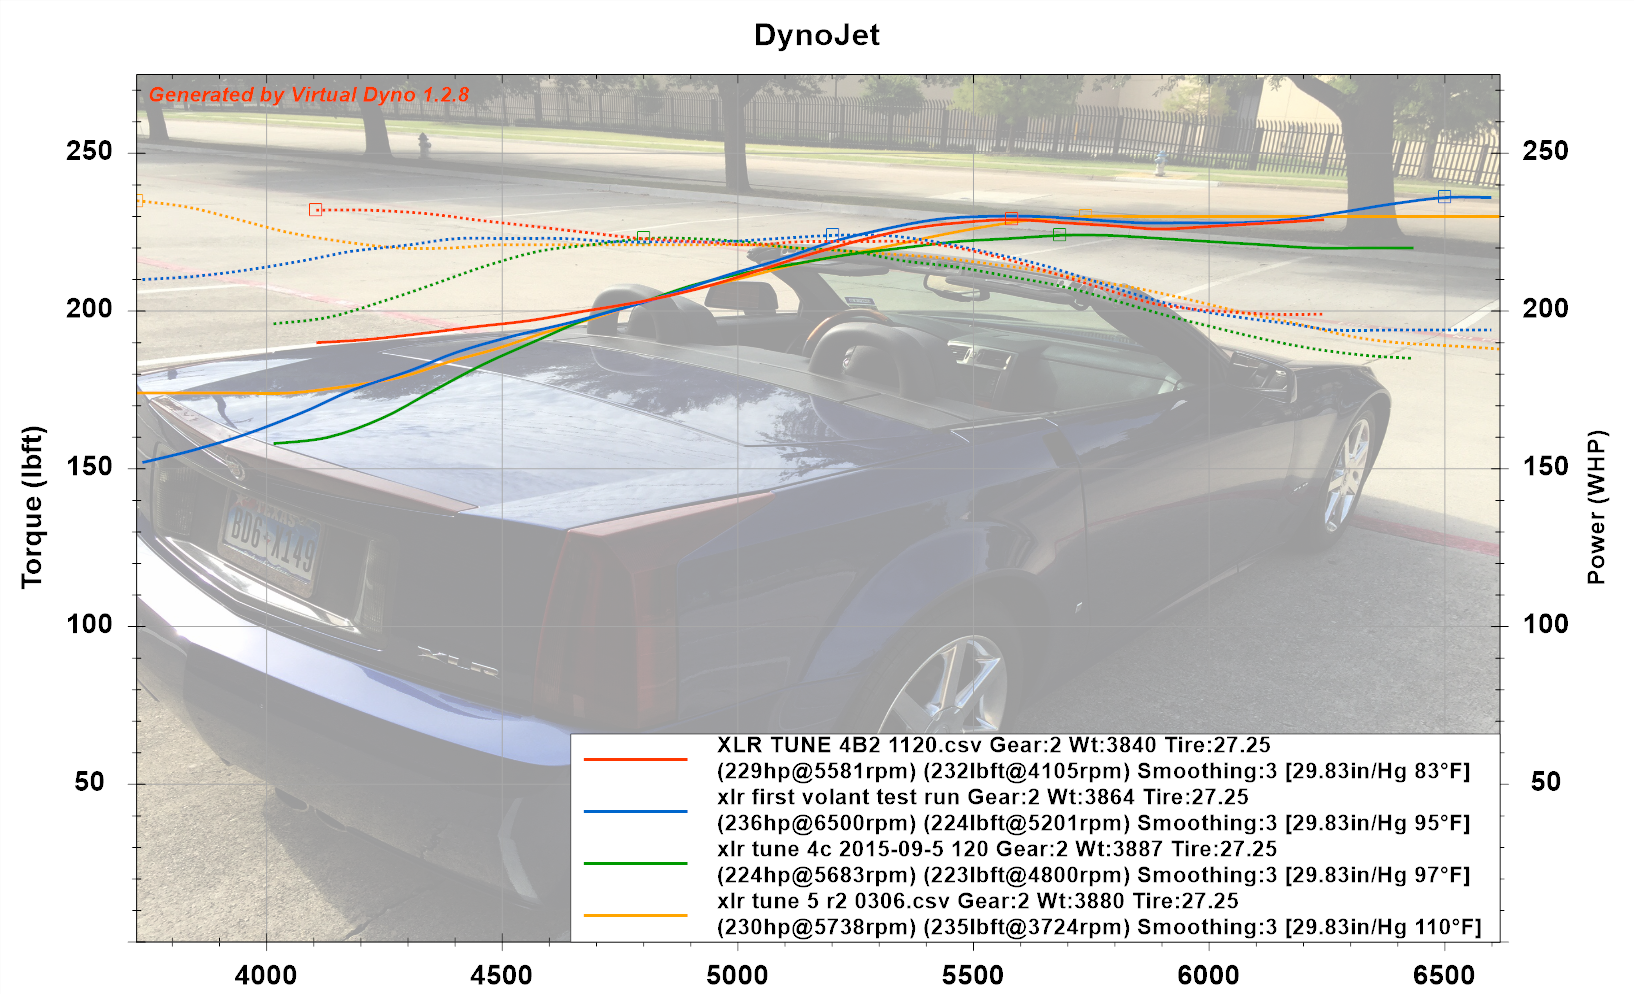
XLR Tune 5 vs Tune 4c vs first volant vs 4B2

With the reset the Intake air temps were up to 113F to start the test, sliding down to 106F at test end.  I don’t have a perfect way to model that so I used 110F as an average; (110F vs 106F is 1 hp delta at peak).   ECT was 205F. Ambient air was 102F.

In this graph the Yellow/Gold line is today’s test.  The Red and green lines are prior Tune 4 runs, and the Blue line is the first Volant test.

What I suspected was the PE changes were causing the slight dip between 5500-6000 and we see some improvement there in today’s run.   The timing changes overall seem to help at lower RPM but don’t appear to be a disadvantage at high RPM.

XLR Tune5 Run2

The increase in TUTD shift speed to 82 did hold the shift til after/at 6700 RPM but there was some fuel cutout prior to shift, so I’ll move that down 1 mph to 81 mph.  I could go back to default functionality of the TUTD which is not to shift automatically at all but for street driving I like the ability to use TUTD to select current gear but have the trans shift at redline.

XLR Tune 5 Test R2 Alone

This graph shows today’s Virtual Dyno test result alone.

Overall I am happy the testing glitch straightened out.  I think pulling back the PE in Tune 5 to OEM helped.  I am still not sure why we see an upward slope in some tests from 6000-6700 rpm and not in others.  I was hoping that was just a test capture issue, but the test result looks flat from 5500-redline.   Recall the AFR goes 0.5 richer for piston protection at 6000 RPM, so that may have an effect, or simply the hot air and timing that is pulled in that region for IAT and ECT, or (not sure).

Next is more baseline testing with Tune 5, or 5B with the slight mph change.

Thanks for reading along; if you have suggestions or wisdom to share please reply below.


Cadillac SRX continues to Lead August Sales

Cadillac SRX once again led all models, at almost 7K sold in August 2015.   Overall sales are up almost 52% for the SRX year over year, and reflect a great product in a market looking for Crossovers & SUVs.  Cadillac can’t get more SRX cousins to showrooms fast enough.

The ATS led sedans at 2,449, followed by CTS at 1730 and XTS at 1531.  Overall sedans were down sharply, continuing the trend on the year.

Escalade sales were strong, at 3080 total units, although down year over year.  I still wonder if this year is capacity constrained there.

The extended electric ELR sales were down to 45 last month, which is below their average of around 100 a month.  ELR down 9% on the year.

  August (Calendar Year-to-Date)
January – August
  2015 2014 %Change Volume   2015 2014 %Change Volume
ATS 2,449 2,804 -12.7   16,544 20,296 -18.5
CTS 1,730 2,592 -33.3   12,934 20,639 -37.3
ELR 45 196 -77.0   704 774 -9.0
Escalade 1,770 2,277 -22.3   13,349 11,415 16.9
Escalade ESV 1,310 1,257 4.2   8,972 6,419 39.8
Escalade EXT 0 1 ***.*   2 50 -96.0
SRX 6,903 4,545 51.9   43,863 38,008 15.4
XTS 1,531 2,978 -48.6   14,423 16,407 -12.1
Cadillac Total* 15,738 16,650 -5.5   110,791 114,008 -2.8

From the press release:

DETROIT – General Motors’ (NYSE: GM) Chevrolet, Buick, GMC and Cadillac brands sold 270,480 vehicles in the United States in August 2015. Retail deliveries climbed 6 percent compared with a year ago, when results included the Labor Day holiday. GM had the industry’s largest retail sales increase and gained more than 1 percentage point of retail market share year over year, based on J.D. Power PIN estimates. Fleet sales were down 24 percent on a 38 percent decline in rental deliveries. Total sales were in line with a year ago.

GM continues to have the highest average transaction prices (ATPs) and had the lowest incentives as a percentage of ATP in the domestic industry, according to PIN.

“GM’s retail sales increase far outpaced the industry in August, and we have grown our retail share for five months in a row compared to last year,” said Kurt McNeil, GM’s U.S. vice president of Sales Operations. “We will continue this momentum with the redesigned Chevrolet Cruze and Malibu, the launch of diesel engines for our midsize pickups, a dramatic restyling of the Chevrolet Silverado and the aggressive rollout of Apple CarPlay and Android Auto.”

GM’s outperformance came in a very strong month for the industry. The estimated seasonally adjusted annual selling rate (SAAR) for light vehicles was 17.5 million units in August, the fourth month in a row above 17 million units – a streak unmatched since 2006.

“All of the economic fundamentals that we look at, including job growth, disposable income and fuel prices, are in good shape and that should keep sales strong,” McNeil said.

Cadillac

  • The SRX crossover was up 52 percent.