Cadillac STS-V performance can be modeled, as with any other vehicle, using software similar to the CarTest 2000. Simulators don’t always give perfect exact real-world predictions of exact performance, but they offer a ready way to test our assumptions and to model and understand the results we do find.
The 2006-2009 Cadillac STS-V has a supercharged DOHC, VVT Northstar rated at 469 hp and 439 lb ft of torque. Originally GM estimated that the engine would produce 440 hp, but in the final SAE certification some assumptions changed — such as normal supercharger coolant temps instead of worst case — and the final rating was 469 hp.
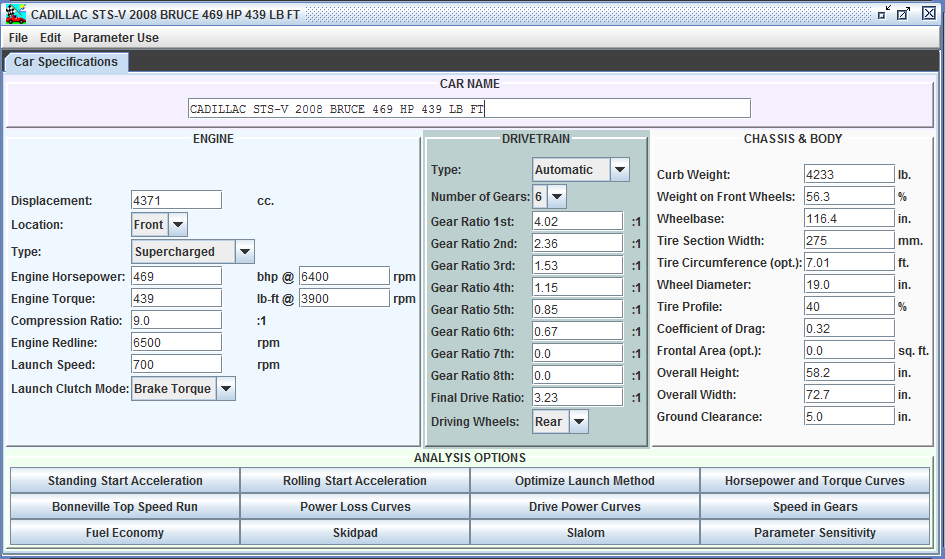
2008 Cadillac STS-V Cartest Stats [click to zoom, back to return]
This screen shows Cartest stats for the car. With peak hp and torque at their RPMs the software can make assumptions on the power curves. Knowing the other stats — weight, gearing, tires — the software can estimate vehicle performance.
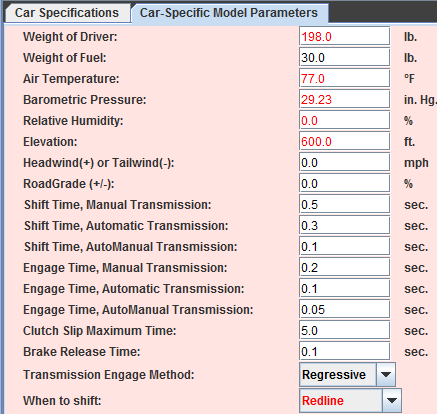
Cartest Car Specific Parameters
Cartest also allows the user to specify car specific parameters. This is helpful in matching real-world conditions. For example, driver weight, altitude, and atmospheric conditions all change the expected acceleration result.
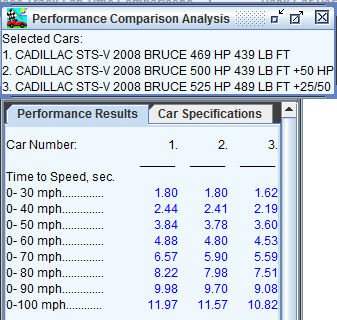
STS-V Comparison Analysis
Cartest allows the user to run a variety of tests; this shot shows some portions of a side by side comparison test of a stock STS-V, a car modified to 500 hp with no change in torque similar to my current mods, and a car with a 10% supercharger pulley — modeled here as an increase of +25 hp / +50 torque. Tim Coeling offers a 2.55″ modified upper pulley for the STS-V.
What we see is that opening up the top end breathing from car 1 to car 2 added +30 hp, as my intake and exhaust mods have, it makes little difference in the estimated performance, 0.1 sec by 60 mph and 0.4 sec by 100 mph. On the other hand, increasing the torque by over driving the supercharger makes more difference to the acceleration. Not surprising since acceleration depends on torque and not hp.
A beauty of the software is that it allows side by side comparison with target models. For example, how does the Cadillac STS-V performance compare to a 2011 BMW M3 track car with 4L, 414 hp V8 screaming at 8300 rpm redline? For this test I have renamed the M3 as “Cadillac STS-V 2008 A Challenger …” for ease of selecting it from the car list:
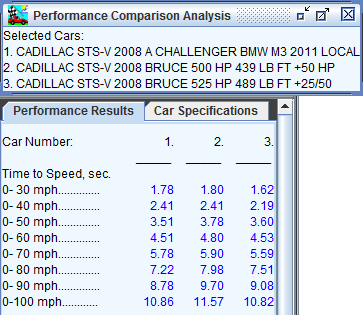
2011 BMW M3 vs 2008 STS-V
What we see here is the 3600 lb M3 makes use of its 7 speed sequential gear box and 600 lb weight advantage to stay ahead of a modified 500 hp STS-V, and match a pulleyed 525 hp STS-V.
When can more power be slower?
It is good to mention that in cases, more power can actually slow a car down. For example, in our analysis above if we take the same STS-V but increase the power to 550 hp with the same torque, it is slower in 0-60 mph, but faster in 0-100 mph.
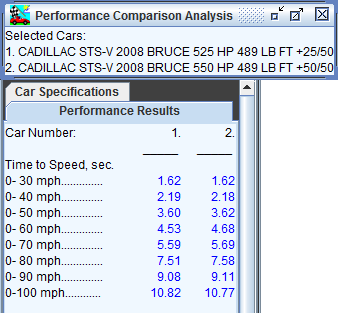
More Power, slower 0-60
I believe that the simulator in this case is anticipating more wheel spin at the 1-2 gear shift due to the increased power. To take advantage of the new power curve the shift points would need to be altered.
Cadillac STS-V Performance
The Cadillac STS-V Performance sedan uses a custom Eaton M122 supercharger. It uses a 2.1:1 ratio, so that the blower as it arrives is spinning x2.1 engine rpm, or 14K+ RPM for the supercharger at 6700 rpm for the engine. [More discussion in my post – Adding Boost Pressure to the LC3] That is also the top range of efficiency for the M122 — past that speed the supercharger starts to make more heat than pressure.
However, because a smaller pulley increases the boost pressure at lower RPMs, and thus the torque, it can have a larger impact on the acceleration of the STS-V than on the peak HP. I will also need to address adding more fuel; the model assumes that I am taking care of how to make the power.

