
Today’s test was not a normal test. First, I was dispatched for a breakfast run to Starbucks, which adds intercooler heat. Second, the highway was jam packed with some problem, and the run was captured in an alternate location. All that noted, I feel we can reach some conclusions.
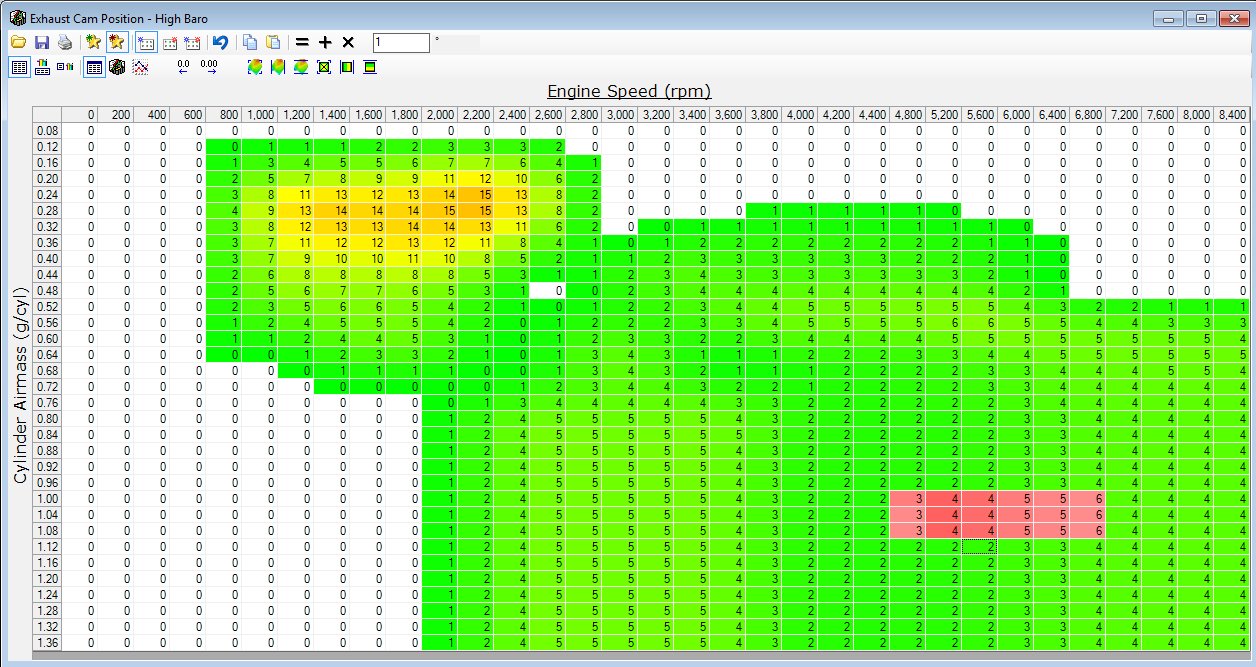
This chart shows exhaust cam position for the VVT timing. The cells in red are our test settings — adding 1 degree of retard at 4800 rpm, and 2 degrees of retard from 5200-6800. What we hope to see is a change in the slope of the HP and Torque curves as a result.
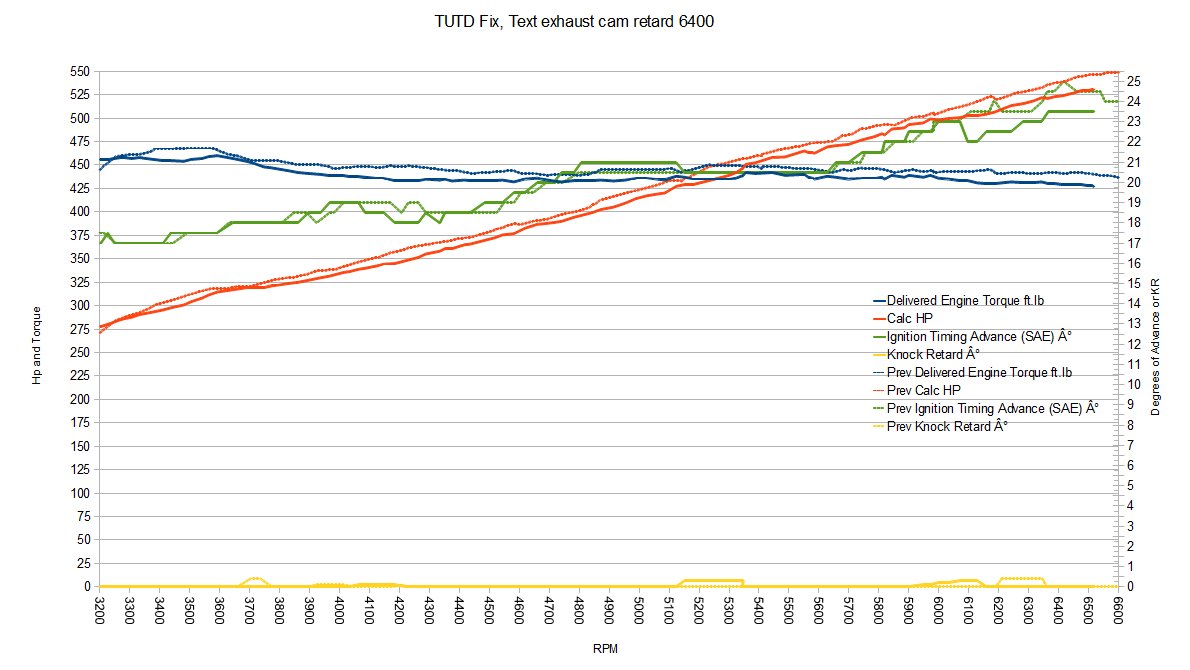
This chart shows today’s hotter run vs previous cooler run. I am not focused on the absolute values so much as the slopes for today’s study. Here is a zoom in from 5800-6600:
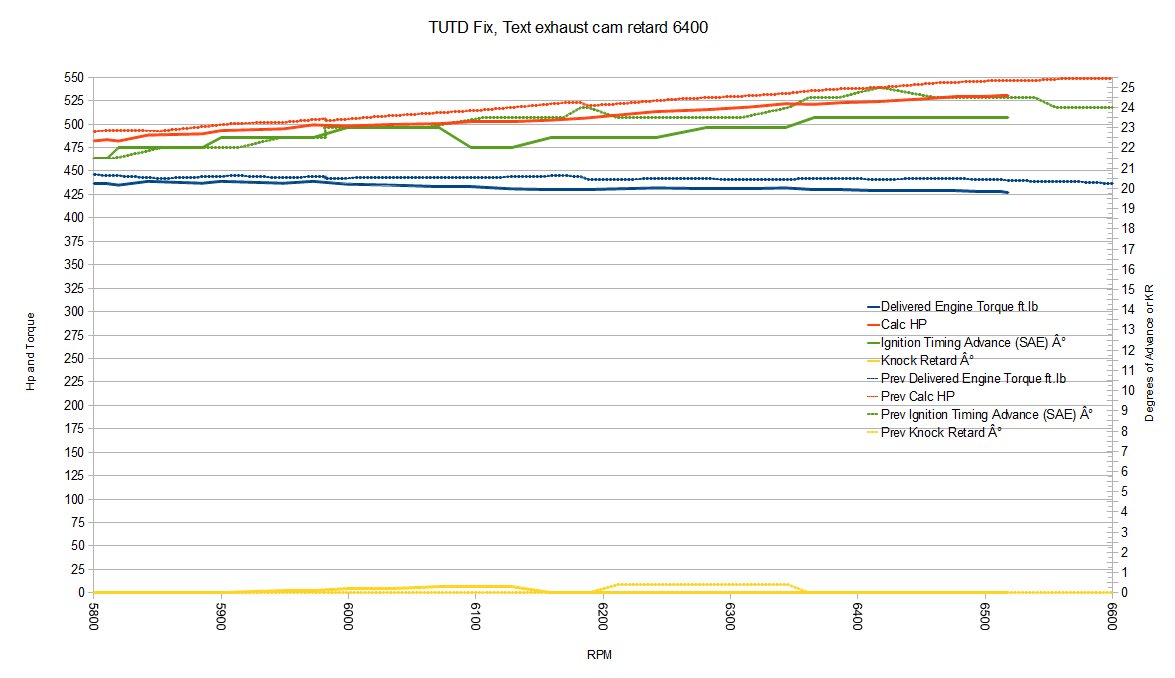
What this appears to show is that the change in the exhaust cam timing didn’t cause a huge improvement or loss in power and torque at 4800-6800. However, the slow of the blue torque curves appears to suggest that the addition is overall not an improvement, since the current curve decreases over time in this range at a faster rate than the previous.
The TUTD shift point did work correctly for this test, so that change will help with future testing.
Next I will restore the exhaust cam VVT timing, and test an adjustment of the intake cam vvt timing.