VVT Tuning & Info for the Cadillac STS-V LC3 V8

I plan to update this page with notes on variable valve timing tuning for the LC3 DOHC VVT Supercharged V8 in the STS-V.

highbaro_vvt_intake

HPTuners Table — Intake Cam position

highbaro_ExhaustCamPosition

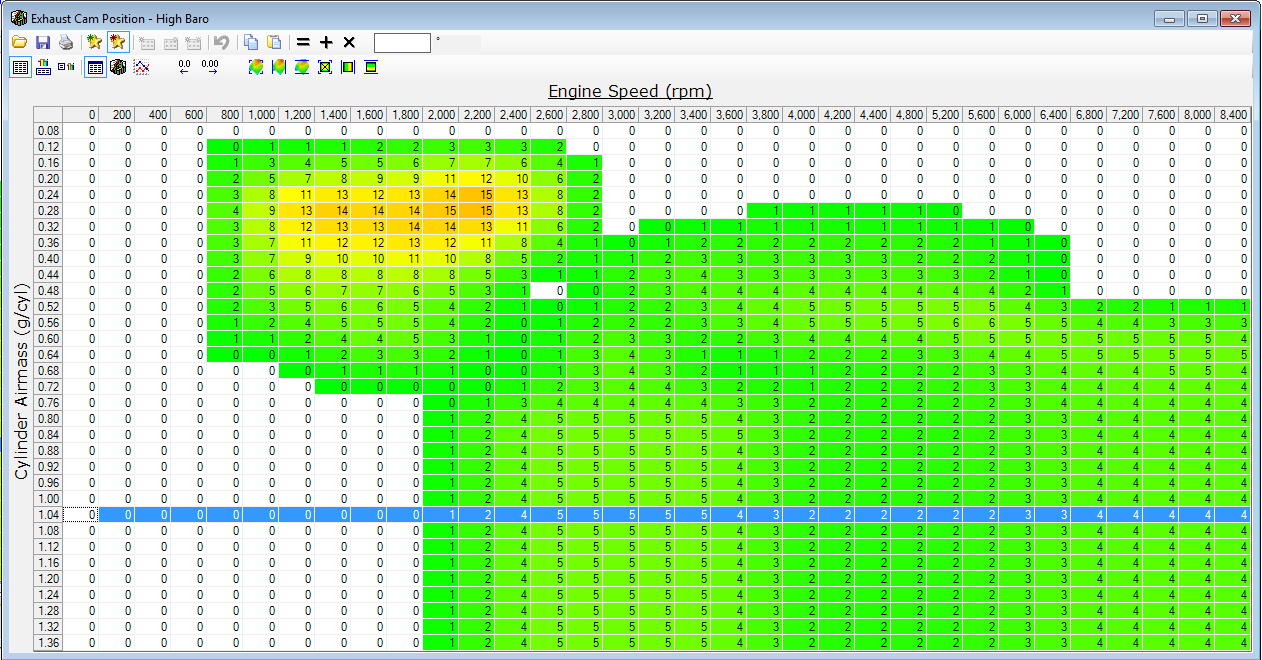
HPTuners table — exhaust cam position

Cam Phasers: [ref]
Intake: Initial timing 133 degrees ATDC with 40 degrees advance authority
Exhaust: Initial timing 117 degrees BTDC with 50 degrees retard authority

Valve Lift: Intake: 10.5mm (.413 inch)
Exhaust: 10.0mm (.394 inch)
Duration @ .050″
Intake: 202 degrees
Exhaust: 214 degrees

VALVETRAIN VARIATIONS
One of the key elements in achieving the broad output of the LC3 is the variable valve timing (VVT) system. With VVT, the seemingly opposed objectives of smooth and torquey low-end output, and massive specific output to a peak at 6400 rpm become possible, using individual hydraulically actuated phasers on each of the four camshaft. “Four-cam VVT is an exceptional performance enabler, but also provides the control flexibility needed for highly advanced NVH and emissions characteristics,” said Dave Caldwell, Northstar V-8 SC development and calibration engineer. “The supercharger module and VVT system complement one another, resulting in a genuine luxury and performance engine.”

This system allows the camshaft phasing to be altered in relation to the piston position, as well as in terms of event timing between the intake and exhaust camshafts. The VVT system was introduced last year on the normally aspirated Northstar 4.6 liter V-8, and the system received all-new command strategy optimized for the supercharged 4.4 liter application. The variable valve timing system makes it possible to target optimal idle quality, control cylinder pressure and detonation, and enhance drive-ability, while providing for the high-speed breathing necessary to turn a number at the top of the power band. Another advantage of the system is a reduction in exhaust emissions, which effectively eliminated the need for supplemental emissions equipment in the form of air injection or exhaust-gas recirculation systems while meeting today’s stringent emissions standards.

Simple cam tuning rules for BOOSTED engines: [ref]

  • Advance intake and exhaust => more low-RPM power, less high-RPM power
  • Retard intake and exhaust => more high-RPM power, less low-RPM power
  • Less overlap => lower EGTs, faster turbo spool, less fuel
  • More overlap => higher EGTs, slower turbo spool, more fuel
  • Conclusion: Advance Both at Low RPM, Retard both at High RPM

What is happening in the VVT cam programming for the LC3:

Intake:  From 3200 to 6400 RPM, position set at 20 degrees
Exhaust:  At low RPM position set at 5 degrees, decreasing to 2 degrees at mid and back to 5 degrees at high RPM

The VVT strategy the factory tune is using seems odd — the hope of VVT is to change the position of the valve timing from low (3200) rpm to high (6400) rpm, but the system appears to command a similar intake (20) and exhaust position (5) for both rev ranges.  The conventional wisdom for boosted engines is more advance for both at low RPM and more retard for both at high RPM.

Challenge:[ref]

The challenge of tuning a motor with VVT is that every change of the cam timing must have a corresponding change to the ignition timing and fuel tables. In one example, a change to the cam timing caused the PCM to enter a different cell on the spark table, which killed the timing and power in the mid to upper rpm as the result.

Feedback

What do you think?  Why did the factory take this strategy?

Cadillac Supercharger Boost Vs RPM Reprise

I studied boost vs RPM for the 2008 Cadillac STS-V LC3 engine in this post but I am back on this topic again.

2013-05-25 Boost vs RPM

This graphic shows the Boost from the Supercharger in pounds per square inch (PSI) of pressure in blue, and the incoming air volume through the mass air flow sensor feeding the supercharger in LB/Min in red.

As we have seen before, the supercharger boost is surprisingly spikey.  The supercharger in the STS-V spins at a 2.1:1 ratio to engine RPM, so at 6000 RPM the supercharger is spinning at over 12,000 RPM.  One would think the boost from the supercharger would be pretty constant.

Of course, constant is a relative term.  The blower is spinning up with the engine and the entire graph above is a less than 4 second interval.  The spikes and troughs tend to be 4 samples over 1/10 of a second.

Here is a zoom in on the run from 6400 RPM to 6700 RPM and boost values:

Time Engine RPM (SAE) rpm Boost PSI
13:03.672 6409 9.1
13:03.687 6452 9.1
13:03.719 6452 9.1
13:03.750 6508 8.8
13:03.765 6540 8.8
13:03.781 6540 8.8
13:03.828 6577 8.8
13:03.844 6608 9.6
13:03.859 6608 9.6
13:03.890 6625 10.0
13:03.922 6651 10.0
13:03.937 6651 9.4
13:03.969 6691 9.1

All of which happens in 0.3 seconds (3/10 of a second).

I don’t see a correlation between the surges in the Supercharger boost pressure and surges in demand of air volume via the MAF; the air through the MAF appears to have a pretty constantly increasing slope.  Perhaps as the RPM goes up and the engine has greater demand for air, and the boost is building, we should see a higher MAF slope than we do?  The MAF slope appears to be increasing at 2900-5900 RPM and lower at  RPM above 5900?  The rate of increase in boost psi also flattens at that point, so the blower may have reached its capacity.

I would like to see a boost graphic for an STS-V with an upper pulley for comparison.

Are there things that could be done to help smoothen the boost output of the blower?


Update:

Here is a graph comparing IAT2 Temperatures (intake air after the supercharger) with the boost curve.  I see a close relationship here.

kn 2013-05-25 boost vs iat2

As the boost goes up the air is getting compressed into the manifold, and the air temperature goes up, making the air less dense, and eventually causing the engine to start to pull timing via IAT2 advance (retard) on hot days.  On this run the engine stays out of that range, but there is the other range that if the IAT were cold enough the computer would add timing.

Virtual Dyno, Wheel HP, Calculated Engine HP, and You #Motorama

My Cadillac STS-V as most modern cars keeps up with how much torque the powertrain is delivering.  It uses this info to make adjustments in power delivery if needed.

Knowing the Delivered Torque, we can derive the Calculated HP, since we know the standard definition HP = (Torque x RPM)/5252

Engine RPM (SAE) rpm Delivered Engine Torque ft.lb Calc Engine HP
3564 423 287.05

Virtual Dyno focuses on lovely HP/Torque graphs of power at the wheels, but of course is based on data tables which one can read from the graph node points.

Virtual Dyno WHP
RPM WHP
4489 272
4600 274
4693 278
4836 284

How do the Virtual Dyno wheel hp values relate to the engine’s calculated hp values for the same data run?

Delivered Torque to Virtual Dyno discussion

The Red line in this chart is the HPTuners Calculated HP.  I have applied smoothing 3, which is to say I have averaged the 3 prior and 3 following values at each point in order to smooth the graph.  The Yellow line is the Virtual Dyno wheel HP values for the exact same test run.

These two measure different things — the calculated hp is power at the crank; the Virtual Dyno is hp at the wheels.  We might expect them to differ by a standard dyno adjustment for transmission losses for automatic transmission vehicles, or 20%.  The Green line is the Virtual Dyno adjusted upwards to account for 20% transmission losses. Still not on top of the engine hp line.

The adjustment needed in this case is around 26%, which is the purple line (between the green and the red lines).  At high RPM this line overlays almost perfectly with the calculate engine HP line, and is closer at very low RPM, although not at mid-range values.

There are multiple sources of error and adjustment variables among these lines.

  • The engine uses a model to determine what makes engine power, which may or may not directly relate to more power at the wheels. I suspect it does relate closely to more power at the crank.
  • My test area is at 635 feet elevation, which is a 3% adder due to air density
  • In Dynojet mode, Virtual Dyno adds 9% to emulate a Dynojet result  — as a side note, I enjoyed this story on Dynojet development
  • Virtual Dyno uses car weight, driver weight, and weather entries.  If I am off on my entry it would effect the calculation.
  • Virtual Dyno is adjusting to SAE standard
  • It also uses vehicle coefficient of drag, and frontal area to adjust for wind resistance.  If I am off on these entries, or have a head-wind or tail wind, it would effect the calculation.

Now all these are normal issues to be dealt with, but the amazing thing I suppose is that it works at all — that we get meaningful data to gauge by.  My purpose for exploring these issues in this article was to get a handle on how the Virtual Dyno result differed from the Delivered Torque.

A short summary might be the STS-V has transmission losses of 22-24% and I am at the equivalent of 3% elevation, so 25-27% losses and that is what we see in the data.  However, one purpose of the thumbrule of average transmission losses for an automatic of 20% and manual of 15% is to be able to compare dissimilar cars — and how much WHP the car is putting down is what matters for how the car moves.  So the long and the short of it is, the car is putting around 400 whp and this car may have to make 540+ hp to do that, but an ‘average’ competitor will be able to do that with 500 hp.

I tend to use both to gauge mods — if the delivered torque / hp go up, that’s good, and I confirm the same trend in Virtual Dyno to determine the benefit of a mod.

What do you think?  Any advice on how to remove any variables or better use the tools?