Cadillac XLR Top-up Testing

This evening I ran some top-up comparison tests to help calibrate and establish a baseline.  Previously I had tested with the XLR top down, enjoying the convertible.  I was focused on monitoring calculated hp/torque, so aero wasn’t a factor.  However, as I am comparing using Virtual Dyno, then aero is a factor and I wanted to know exactly how much of a factor, and to establish a top-up value.

VD XLR Comparison Premium Top Up

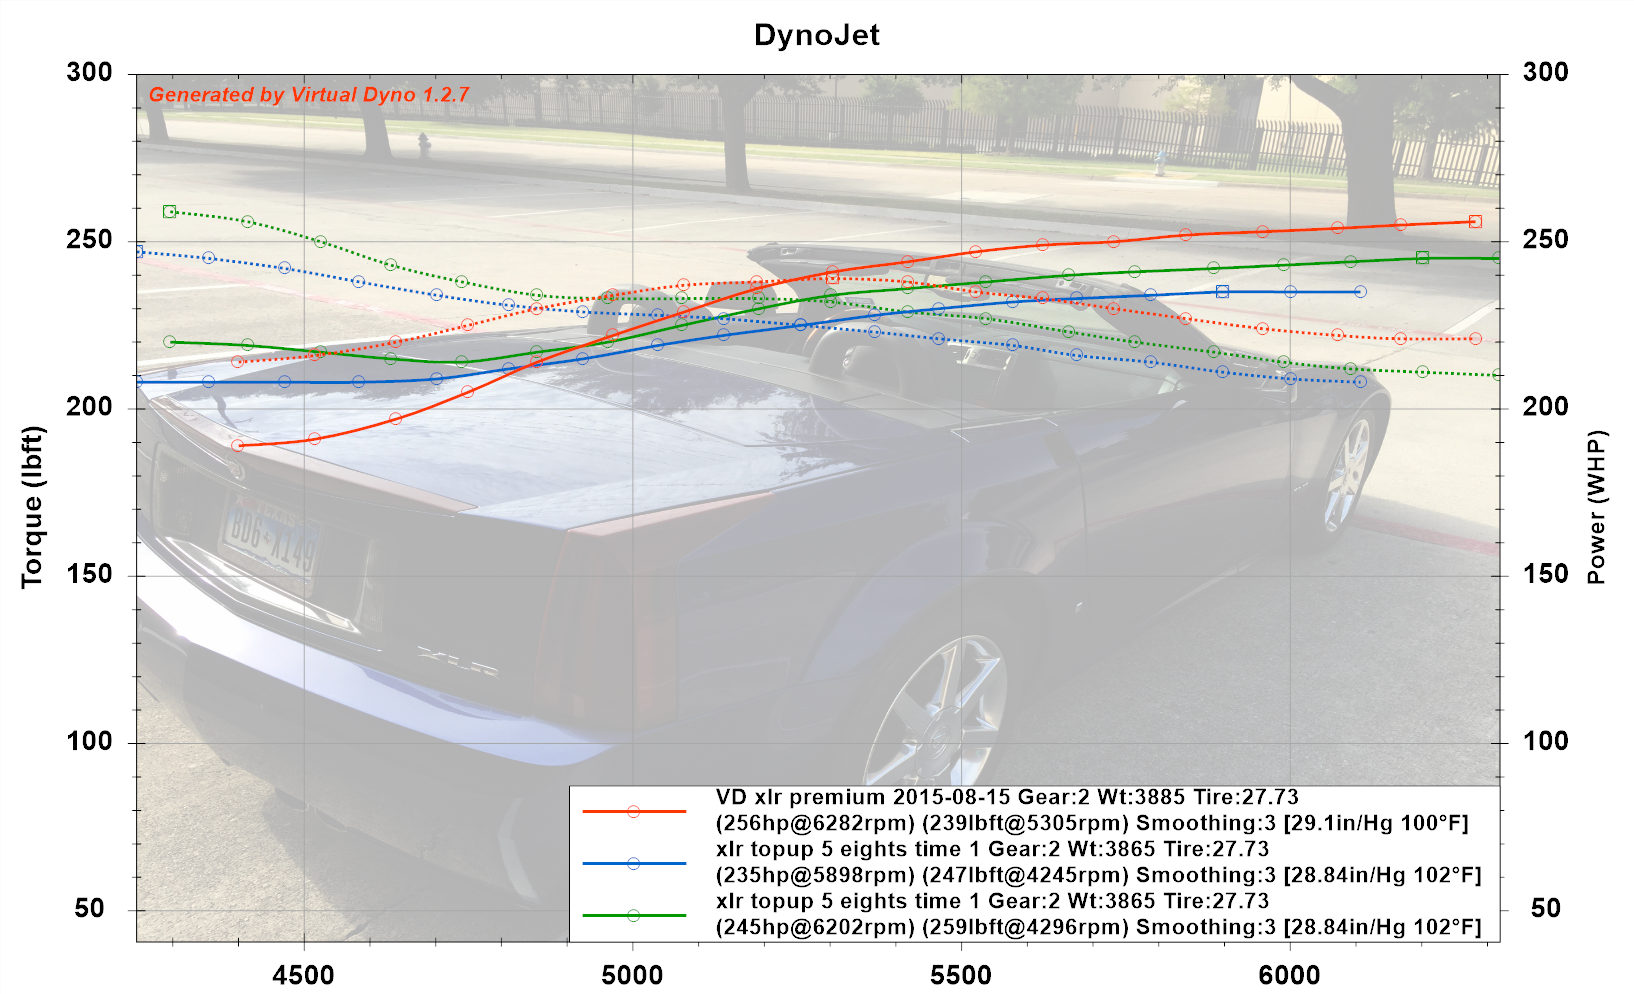
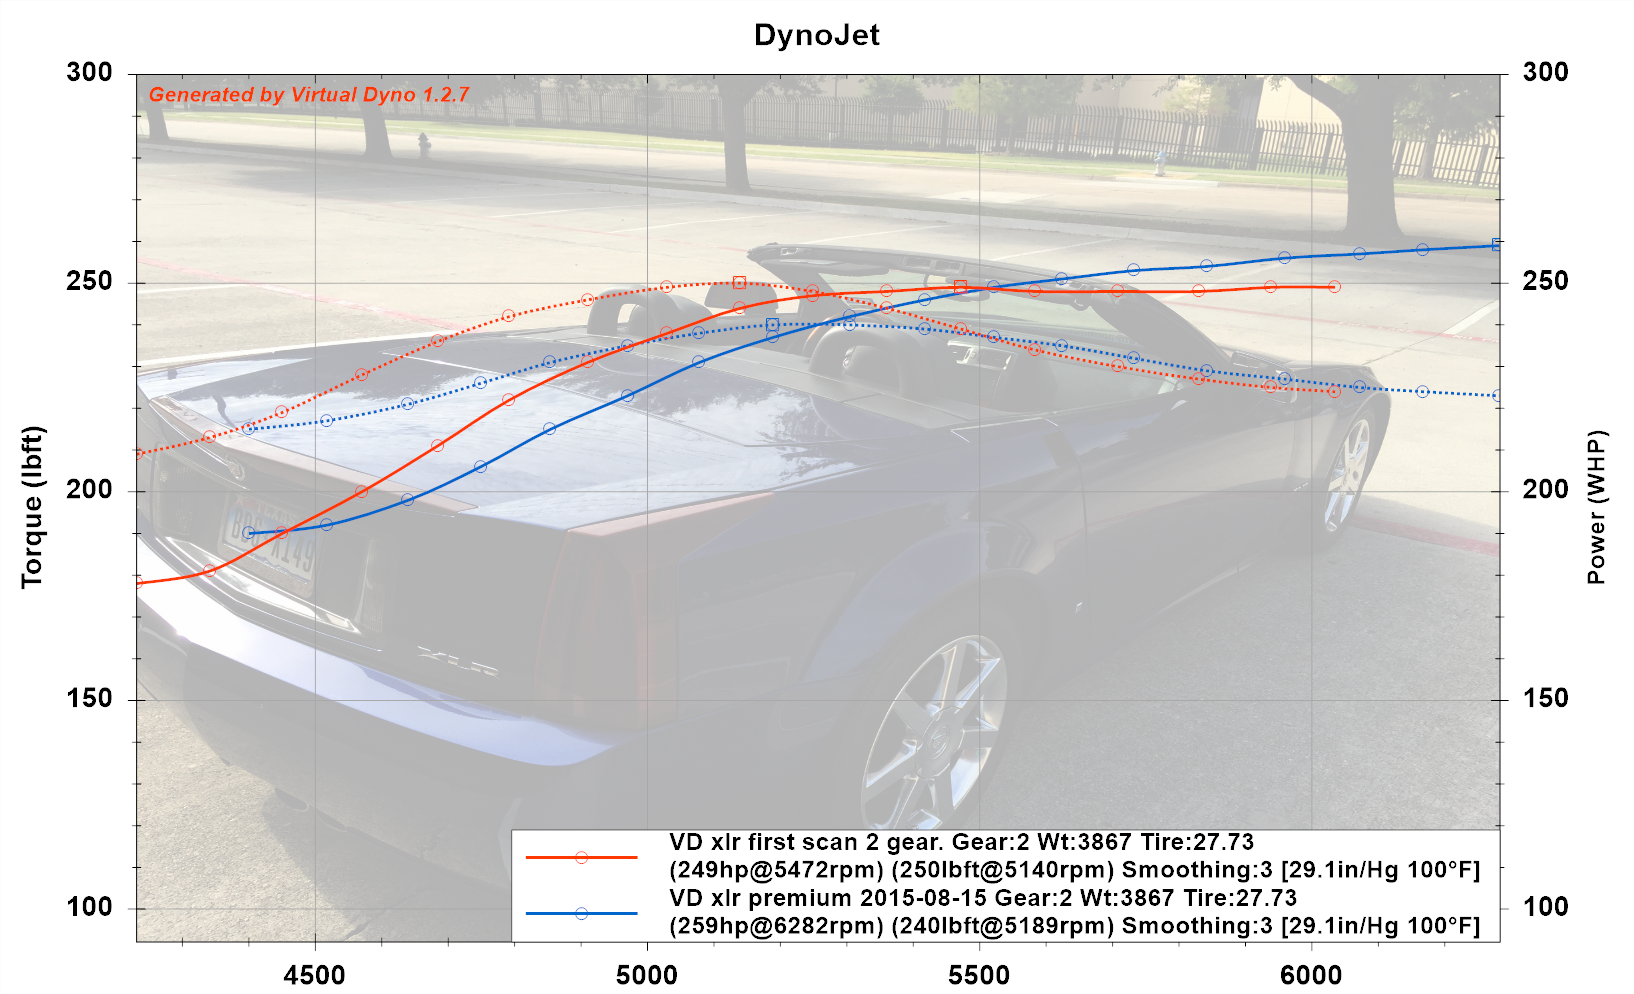
[click to zoom in, back to return here] [This chart was based on incorrect tire diameter — see replacement chart below]

The Red line is the previous, Top-down test at 256/239 whp/lb-ft.  Tonight’s comparable run from the exact same location is the Green line at 245/259 whp/lb-ft.  The Blue line is another run tonight at a separate test location at 235/247 whp/lb-ft.  Tonight’s runs were lower HP, higher Torque.

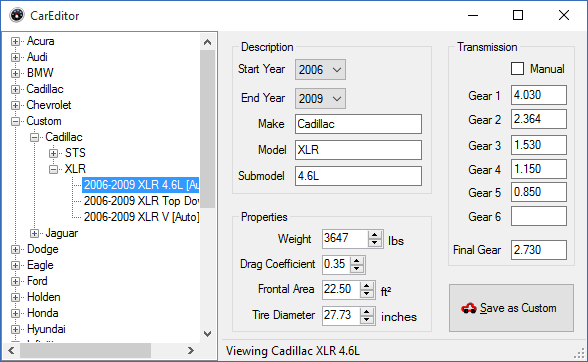
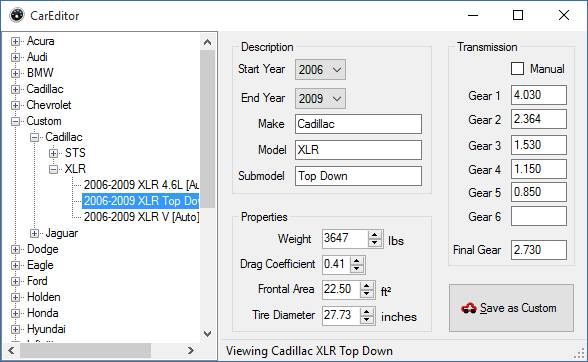
With the top up or down, the variance is in CD, or coefficient of drag.  In my previous setup I wrote that I modeled the top-down impairment as a 0.05 CD adder.  For today’s test I have left that delta alone, but I have revised the base CD to the 0.31 that Cadillac marketing materials said for the XLR, instead of the 0.35 one of the early magazine reports quoted.  So Top-Up CD is modeled at 0.31, and top-down at 0.36.

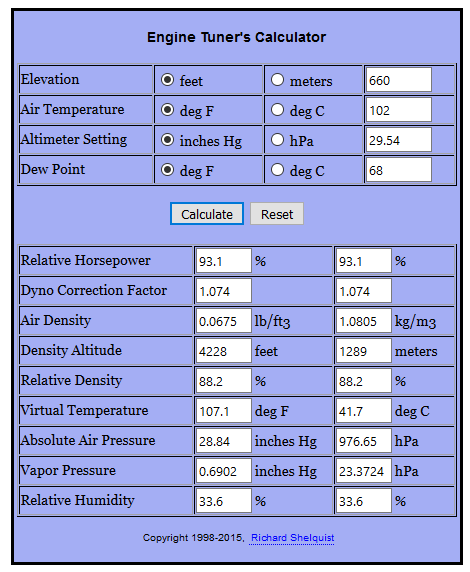
I am using ‘absolute pressure’ from the dew point calculation for baro pressure for the virtual dyno calc.  This takes altitude and local barometric pressure into account.  Thanks to Richard Shelquist!

xlr premium comparison tuner calc

My conclusions are that tonight’s runs were lower results than the previous baseline.  This may be normal day-to-day test-to-test variance (unknowns not accounted for), or it may suggest that the top-down drag disadvantage for the XLR is not as great as 0.05.

I enjoyed the XLR all day, and it was out in the sun prior to the tests.  The important thing is to capture sufficient baseline data and to establish a baseline, and eliminate test to test variability.  I may have to either only run tests first thing in the morning to avoid heat soak, or only run tests with the car heat soaked (!)

XLR tire diameter

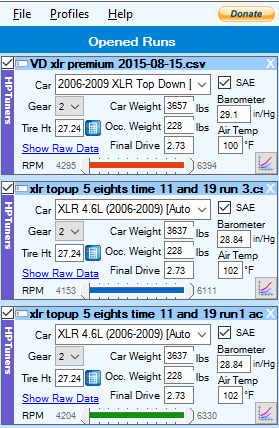
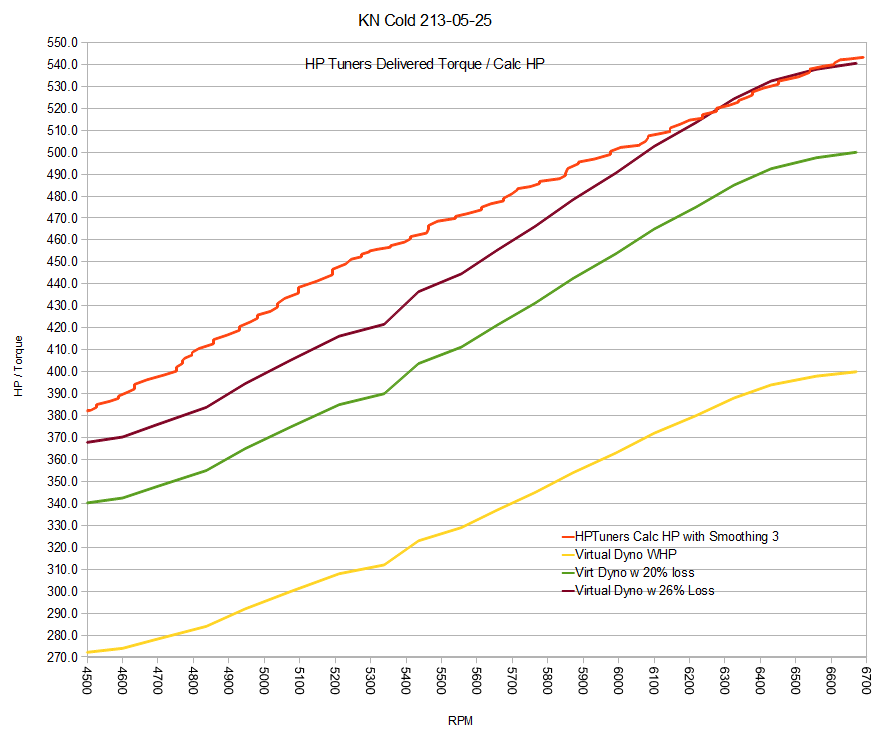
Update:  the previous Virtual Dyno setup used 27.73 as a tire diameter, and I see from the calibration file it should be 27.24.  This changes the results to following table:

Virtual Dyno XLR Tops Down comparison tires

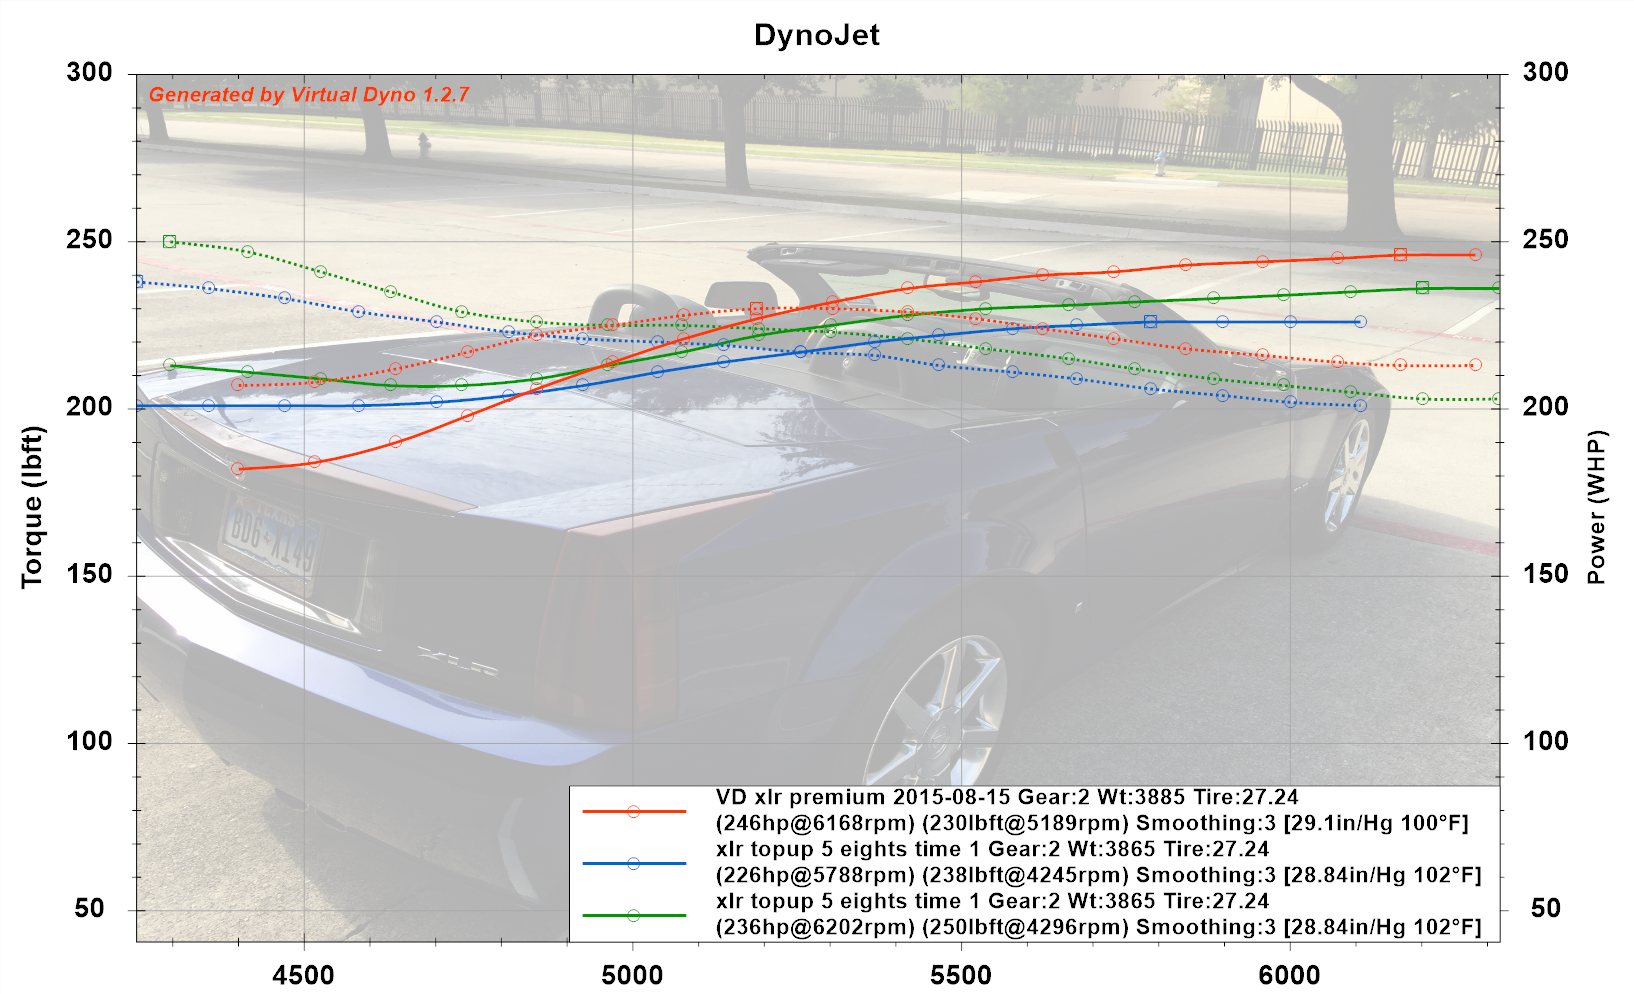
Which is less than expected.  I am including both charts for now to document my confusion, and to assist in analysis.  Yes, tire size has a significant impact on calculated results.  With SAE adjustments for conditions the 320 hp rated LH2 should make approximately 256 whp; I am uncertain why today’s results are 226-236 whp.


Cadillac XLR Virtual Dyno calibration

Using my initial and second (premium) run data captured from HPTuners, I did some Virtual Dyno Analysis (see my initial Virtual Dyno article here).  First I needed a new custom file for the XLR:

Virtual Dyno XLR data

I had run the test data with the top down (worse aerodynamics), and I used a back-to-back wind tunnel test of a different car (Miata) to model the degradation of top down as .06 CD.  I will want to run virtual dyno tests with top up in the future?

I created a 2nd custom file to model the XLR with top down:

Virtual Dyno XLR Tops Down

I edited the .csv saves from Hptuners to only include the acceleration range desired, and loaded both runs.

VD XLR Setup initial Comparison - CD adjusted +.06 for Top down

[click on image to zoom in, back to return]

I adjusted the SAE conditions for the pressure and temps during the test, 29.1 in/hg baro and 100F.  The car intake air was actually a bit higher.  I am not sure this adjustment is quite right — the reference site suggests a dyno adjustment of 4.5% for test conditions.  The Virtual Dyno not-SAE – to SAE goes from 251 to 259 or a 3.2% increase.  A 4.5% increase would be 262 whp, so not much difference really.

The results, 249 whp for the initial test, and 259 whp for the known-quality premium fuel test, seem consistent with expectations.  259 whp / 0.8 transmission losses = 324 hp.  Cadillac rated the stock XLR LH2 V8 engine at 320 hp.

One might conclude the difference between believed-regular unleaded and known premium unleaded in this test case was 10 whp (13 hp).  This is similar (9 hp) to what the calculated hp values showed.

The calculated engine hp vs virtual dyno:

Initial:  2nd gear 293 calc hp x 1.045 conditions adj = 306 hp
Virtual Dyno 249 whp / .8 trans loss = 311 hp

Premium: 2nd gear 302.3 calc hp x 1.045 conditions adj = 315 hp;
Virtual Dyno 259 whp / .8 trans loss = 324 hp

Or told in the other order:

Initial: 306 adj hp x .8 trans loss = 244 whp
Virtual Dyno: 249 whp

Premium: 315 adj hp x .8 trans loss = 252 whp
Virtual Dyno: 259 whp

Note in both tests 1st gear calculated hp was higher, and for comparison with Virtual Dyno analysis of the same runs I am using 2nd gear hp data.

Virtual Dyno depends on consistent, level test area, weights (with/without fuel for example), and conditions for comparable results.  It has however been tested over and over to be consistent with dynojet results when done with proper care.

My conclusion is that I need to do a few more captures of consistent test data for Virtual Dyno use, but the configuration files I have predict results consistent with my other indicators.


HPTuners, Delivered torque, Virtual Dyno, SC losses

I have been quoting delivered HP values in recent articles, and these are quick and easy to ref.  This is a PCM calculated value that converts air flow to torque using air/fuel ratio and spark advance.
In an article here http://caddyinfo.com/wordpress/wheel-hp-calcualted-hp-and-you/ I showed a comparison of calculated hp for my STS-V vs Virtual Dyno results.

  
In that analysis I found there were 26% losses from calc hp to virtual dyno.  My current theory is that delivered hp does not account for supercharger losses, or the hp to turn the supercharger.   Further, With est transmission losses at 20%, that analysis shows supercharger turning loss to be ~6%, or as accurately can be modelled as 40 hp.  [also possible it does include sc turning losses, and delta is greater losses due to 1 or 2nd gear not 1:1]

I continue to find Calc HP to be useful and quick to reference, for comparison a 6% loss must be considered as well – so a comparable engine dyno after S/C pumping loss would be 6% less.  If the calc hp was 522, adjusted for conditions = 556, after s/c 522 crank hp, dyno-equivalent after 20% trans loss would be .8 x 522 = 417 wheel hp or whp.  I think that is the factor I was missing previously, and will save some analysis somersaults.  While delivered torque gets a lot of poor press on the web, the shape of the curve and values do validate against the virtual dyno analysis of the same data and the dynojet tests I have done.

What do you think?