HPTuners, Delivered torque, Virtual Dyno, SC losses

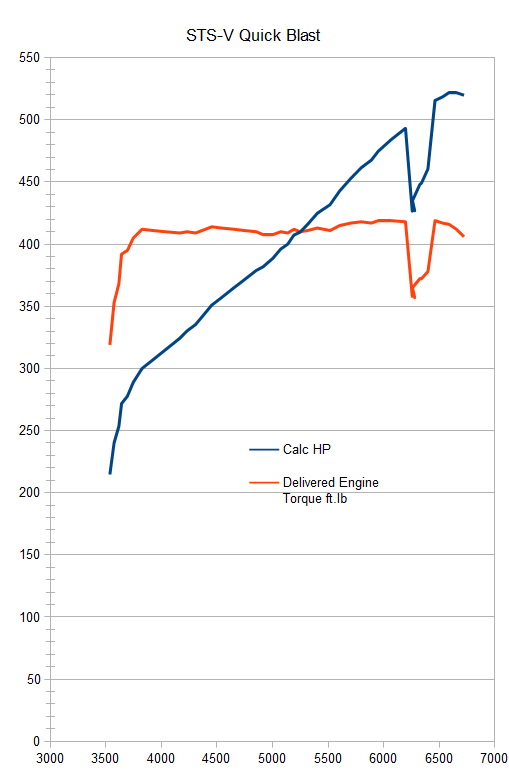
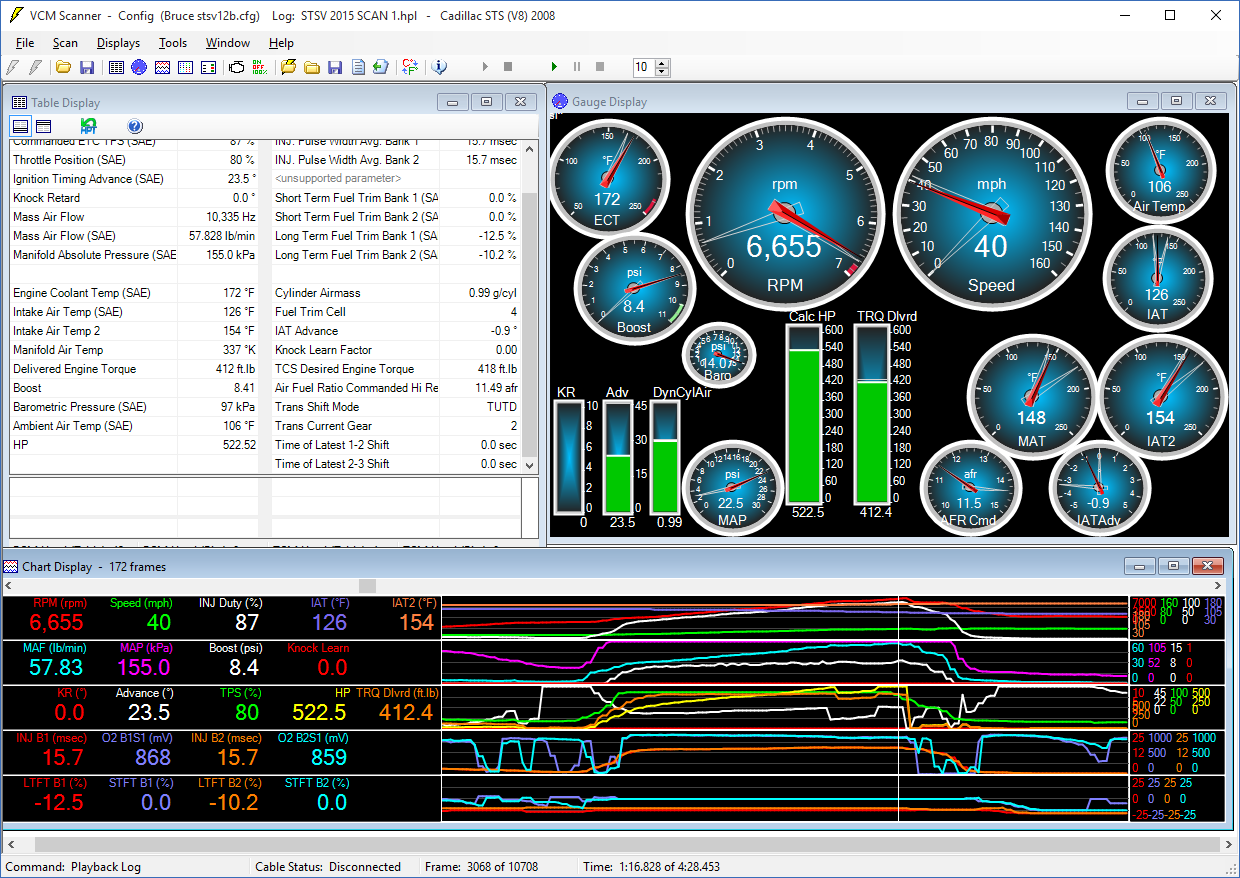
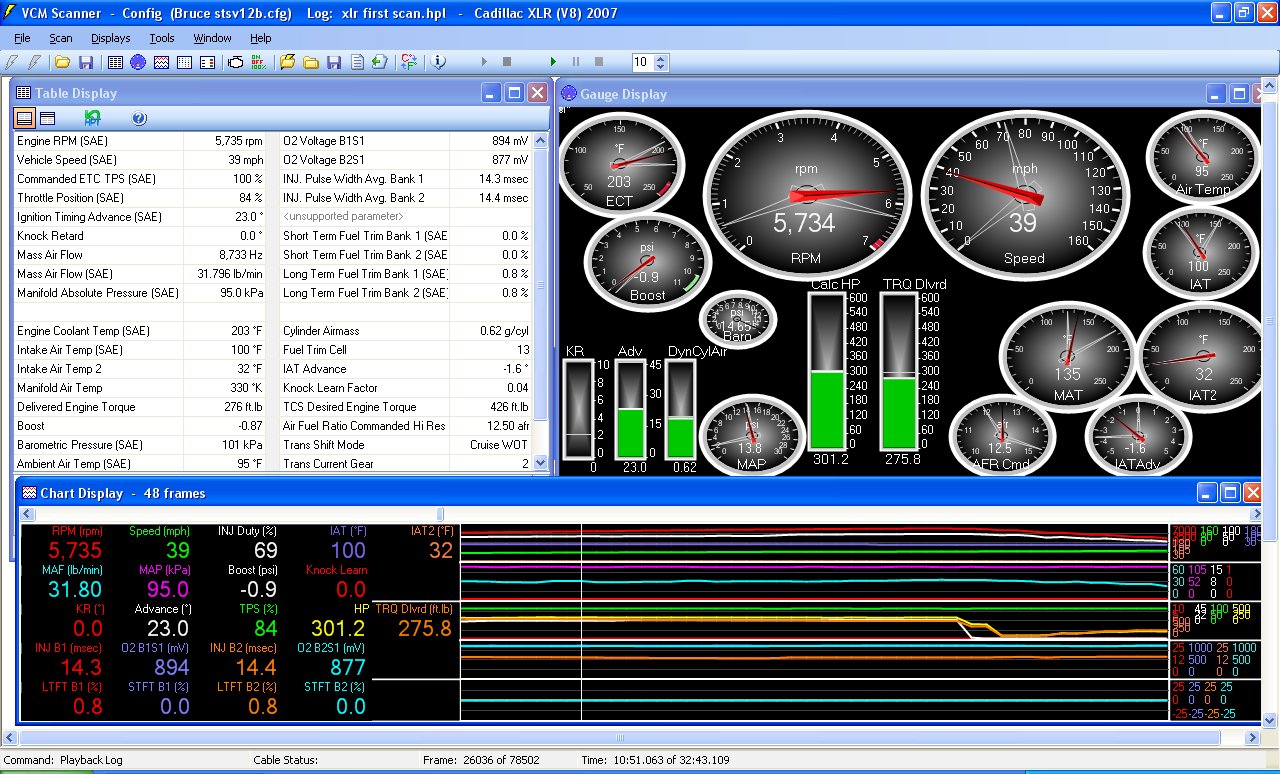
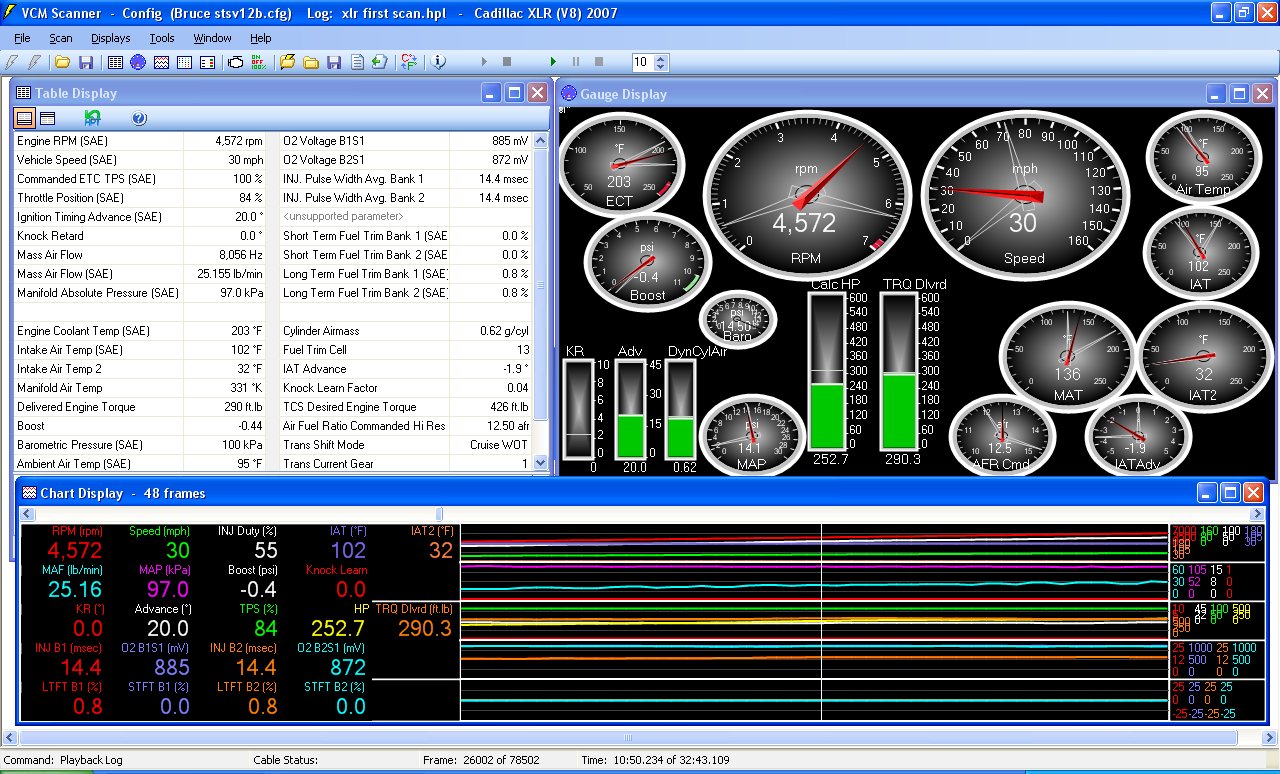
I have been quoting delivered HP values in recent articles, and these are quick and easy to ref.  This is a PCM calculated value that converts air flow to torque using air/fuel ratio and spark advance.
In an article here http://caddyinfo.com/wordpress/wheel-hp-calcualted-hp-and-you/ I showed a comparison of calculated hp for my STS-V vs Virtual Dyno results.

  
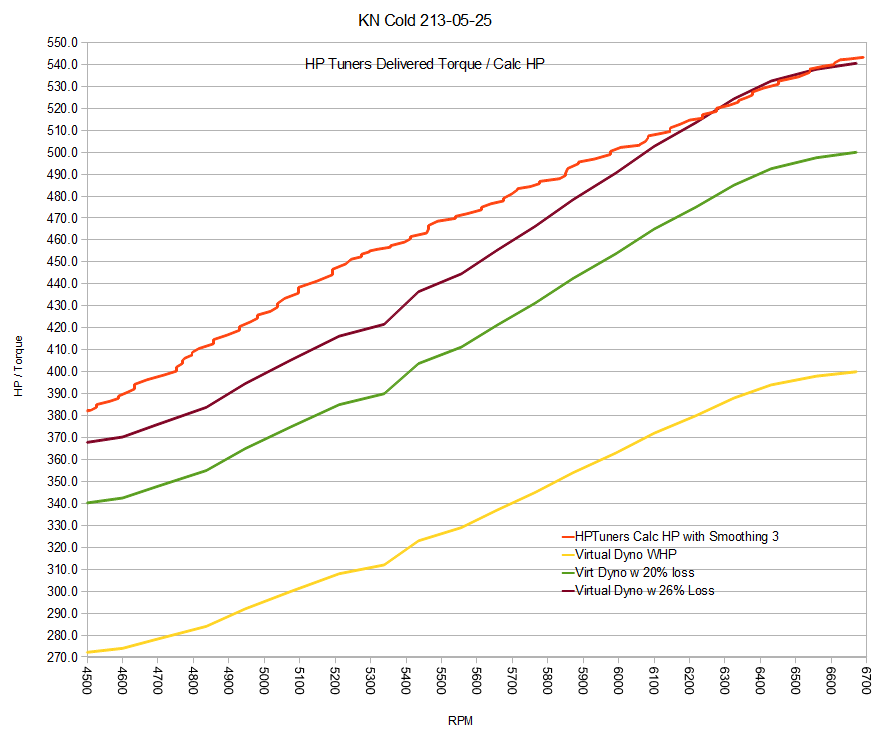
In that analysis I found there were 26% losses from calc hp to virtual dyno.  My current theory is that delivered hp does not account for supercharger losses, or the hp to turn the supercharger.   Further, With est transmission losses at 20%, that analysis shows supercharger turning loss to be ~6%, or as accurately can be modelled as 40 hp.  [also possible it does include sc turning losses, and delta is greater losses due to 1 or 2nd gear not 1:1]

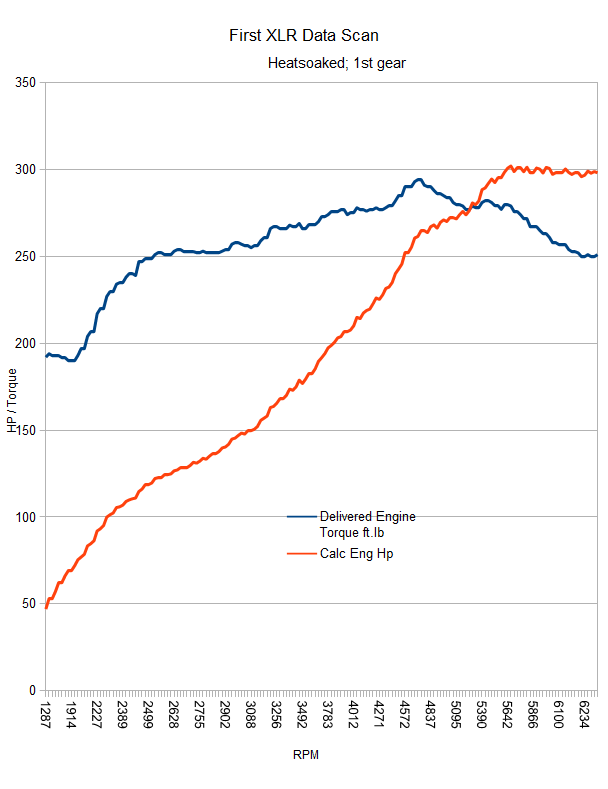
I continue to find Calc HP to be useful and quick to reference, for comparison a 6% loss must be considered as well – so a comparable engine dyno after S/C pumping loss would be 6% less.  If the calc hp was 522, adjusted for conditions = 556, after s/c 522 crank hp, dyno-equivalent after 20% trans loss would be .8 x 522 = 417 wheel hp or whp.  I think that is the factor I was missing previously, and will save some analysis somersaults.  While delivered torque gets a lot of poor press on the web, the shape of the curve and values do validate against the virtual dyno analysis of the same data and the dynojet tests I have done.

What do you think?

Quick STS-V tune check-in

Cadillac_STS-V Composite

Grabbed my gear and ran a quick scan on the STS-V to see how it is doing 2 years later.  Odd divot in the pull but could have been situational in the way I did the test; I don’t see an obvious cause in the data.

sts-v quickblast 2015-08-18

Here is a snapshot of the HPTuner screen at max hp (522).  Gotta love a supercharged V8.

stsv 2015 scan1

I will re-run later in the week to see if divot is an anomaly or something to address.  I didn’t realize the divot was there until I reviewed the data to post.  The engine pulls 12 degrees of advance there — perhaps the traction control kicked in?

I was watching during the drive to see how the IAT2 responded, to tell me if the pump was running, coolant circulating, etc for the intercooler.  That seems to be the case.  The STS-V was heatsoaked, it was hot here (100F), IAT1 just starting the test at 120F, and IAT2s at 154F.  Hot, hot, hot.  

  
The correction factor for environmental conditions the car saw was 1.065, so still around 522.5 x 1.065 = 556 corrected hp similar to 2013 tests.


Initial Cadillac XLR Hptuners Scanner setup

IMG_2983.JPG

Tonight I setup my test laptop with HP Tuners in the 2007 Cadillac XLR to see if it would all play together — with some success.

xlr first test 1 gear max hp

I used the scanner profile that is setup for my 2008 STS-V,  which makes for good comparison but perhaps higher scales than the XLR needs.  The XLR was well heat soaked, and it was warm here in Texas still even though evening time.  Intake air was 95 F outside, 100 F coming into the engine, and 135 F in the manifold.   Plano is at 600 ft elevation above sea level.

What I see in this initial scan is a) it works at all and b) the XLR PCM calculated that the engine output was around 301 hp in 1st gear at 5734 rpm. It stayed around 300 hp from there to when it shifted.   The XLR LH2 V8 is rated at 320 hp at 6400 rpm under ideal test conditions at sea level, 70 F etc.

xlr first test 1 gear max torque

Max first gear calculated torque was 290 lb ft at 4572 RPM.  The LH2 is rated at 315 lb ft of torque at 4400 rpm under SAE test conditions.

320 hp LH2 Rear-wheel Drive Variant

320 hp LH2 Rear-wheel Drive Variant

On first blush, I am pleased that I got the test gear working, and the HP tuners can talk to the XLR,and I can capture data and post it.  Now I can study what it means lol.

XLR first scan

This is a graph created from a data export from hptuners vcm scanner of the delivered torque, and derived calculated hp.