Cadillac Supercharger Boost Vs RPM Reprise

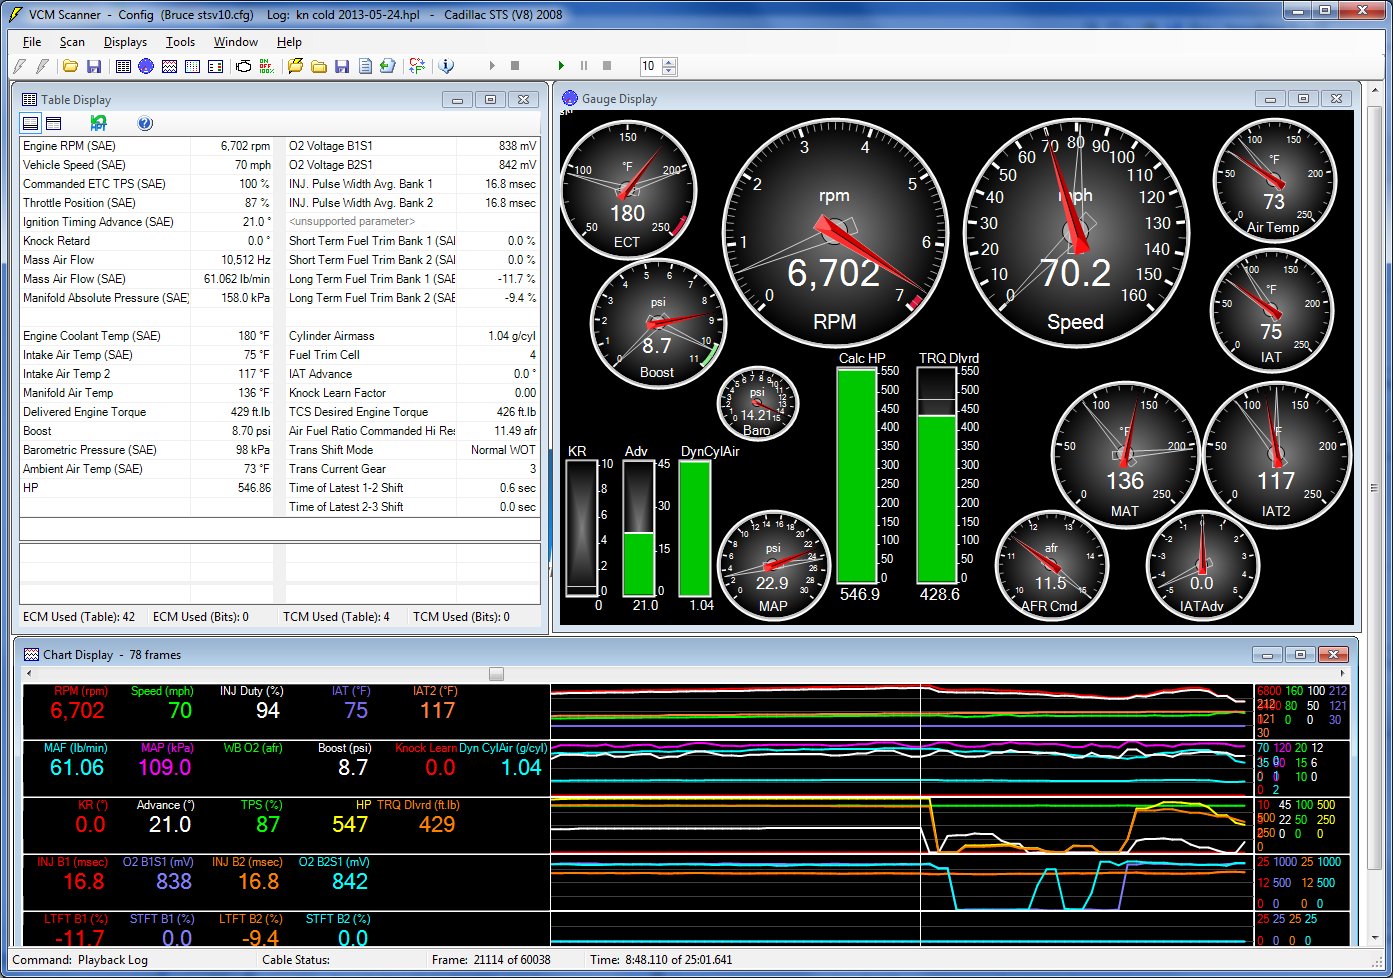
I studied boost vs RPM for the 2008 Cadillac STS-V LC3 engine in this post but I am back on this topic again.

2013-05-25 Boost vs RPM

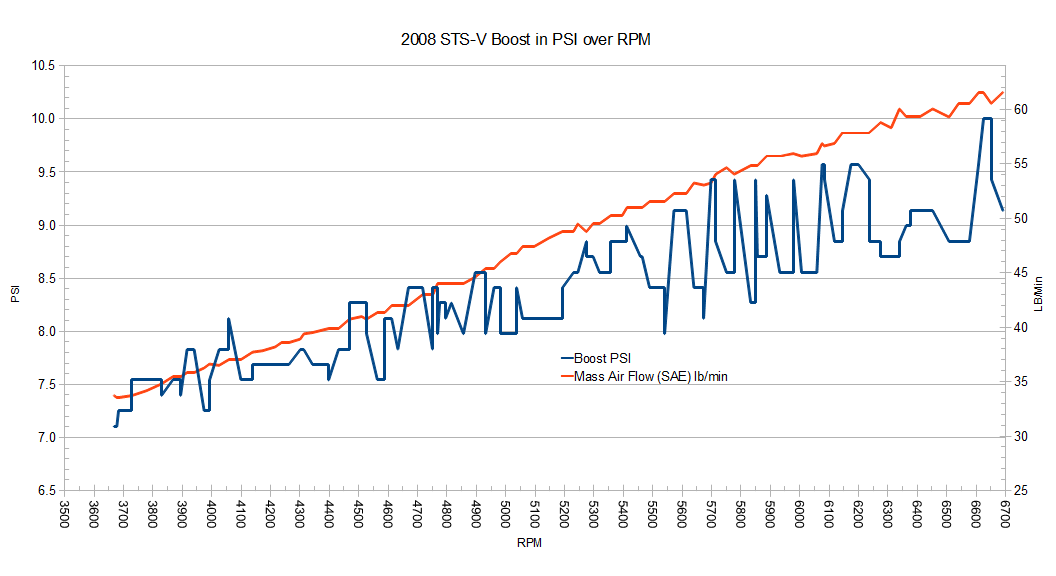
This graphic shows the Boost from the Supercharger in pounds per square inch (PSI) of pressure in blue, and the incoming air volume through the mass air flow sensor feeding the supercharger in LB/Min in red.

As we have seen before, the supercharger boost is surprisingly spikey.  The supercharger in the STS-V spins at a 2.1:1 ratio to engine RPM, so at 6000 RPM the supercharger is spinning at over 12,000 RPM.  One would think the boost from the supercharger would be pretty constant.

Of course, constant is a relative term.  The blower is spinning up with the engine and the entire graph above is a less than 4 second interval.  The spikes and troughs tend to be 4 samples over 1/10 of a second.

Here is a zoom in on the run from 6400 RPM to 6700 RPM and boost values:

Time Engine RPM (SAE) rpm Boost PSI
13:03.672 6409 9.1
13:03.687 6452 9.1
13:03.719 6452 9.1
13:03.750 6508 8.8
13:03.765 6540 8.8
13:03.781 6540 8.8
13:03.828 6577 8.8
13:03.844 6608 9.6
13:03.859 6608 9.6
13:03.890 6625 10.0
13:03.922 6651 10.0
13:03.937 6651 9.4
13:03.969 6691 9.1

All of which happens in 0.3 seconds (3/10 of a second).

I don’t see a correlation between the surges in the Supercharger boost pressure and surges in demand of air volume via the MAF; the air through the MAF appears to have a pretty constantly increasing slope.  Perhaps as the RPM goes up and the engine has greater demand for air, and the boost is building, we should see a higher MAF slope than we do?  The MAF slope appears to be increasing at 2900-5900 RPM and lower at  RPM above 5900?  The rate of increase in boost psi also flattens at that point, so the blower may have reached its capacity.

I would like to see a boost graphic for an STS-V with an upper pulley for comparison.

Are there things that could be done to help smoothen the boost output of the blower?


Update:

Here is a graph comparing IAT2 Temperatures (intake air after the supercharger) with the boost curve.  I see a close relationship here.

kn 2013-05-25 boost vs iat2

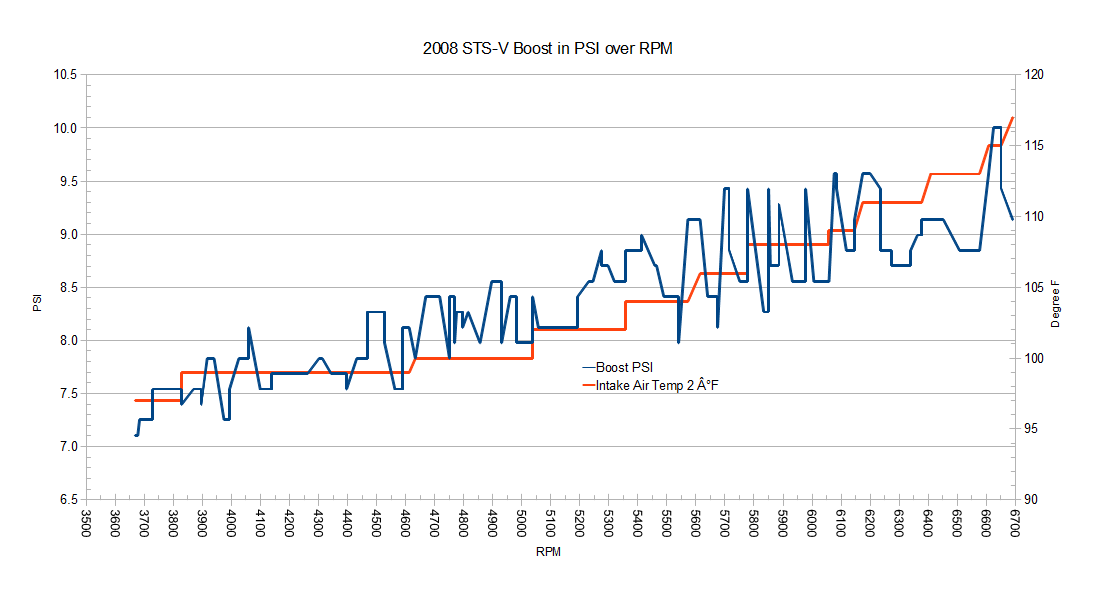
As the boost goes up the air is getting compressed into the manifold, and the air temperature goes up, making the air less dense, and eventually causing the engine to start to pull timing via IAT2 advance (retard) on hot days.  On this run the engine stays out of that range, but there is the other range that if the IAT were cold enough the computer would add timing.

More Air Filter Testing – K&N on Spectre CAI Cold/Full

I am gathering more test information using HPTuners and Virtual Dyno on my 2008 Cadillac STS-V across different modifications.  Today’s runs with a full tank of gas and nice weather after an overnight rain.  HPTuners shows the baro that the engine perceives, so I am using that for baro adjustments.

KN cold 2013-05-25 2 run comparison with weird midtorque run adjusted

This morning’s run in red vs the previous odd run in blue.  Today’s run showed the expected shapes — high torque at low RPM, high HP at high RPM.  Huge torque reading at low RPM today.  Not sure what additional variables the automatic transmission might be tossing in — these runs are in TUTD (touch up, touch down) mode with 2nd gear manually selected.  I have also adjusted yesterday’s run to reflect that it was with lower fuel before I filled up today.

hptuners for kn cole 2013-05-25 1300203

The Virtual Dyno is estimating wheel horsepower.  400 WHP with 20% drivetrain losses for an average automatic would equate to 500 hp at the crank.  HP Tuners estimated the engine was making 543+ hp at the crank for an instant at 6651 RPM, and above 520 from 6300 RPM on; 1- 400/520 hp  which would be a 23% drivetrain loss.  My goal for the STS-V was to get to a solid 400 WHP, which was reached with exhaust and CAI. Now I would like to get to a solid 425 WHP…

After the huge mid-RPM torque and low high HP run in the comparison above, I made an adjustment to ensure the engine wasn’t limiting boost.  In this theory, if the supercharger were breathing better and hit a higher boost point earlier than expected, the PCM might pull boost at high RPM.

Today’s run showed the engine is pulling and building boost all the way to fuel cutoff.  So either the previous odd run was just that, an odd dataset, or the new adjustments are working.

Here is a comparison of last night’s hot run vs today’s cold run:

kn cold 2013-05-25 comparison to kn hot 2013-05-24

Both of these are adjusted for weight, barometer, and temperature per the SAE standard, so they should read identically (within the error of the method used).  However, my STS-V is effected by heat to a greater degree than the standard adjustments correct so even with adjustments hot reflects lower results than cold.  This has added a dimension to testing.


Update:

Today’s graph had some data noise at the beginning of the run that caused the high torque spike.  With that removed the updated graph below is correct for today:

KN 2013-05-25 Correction

Re-test of K&N filter on Spectre CAI with Virtual Dyno

This morning I ran some cold comparison tests for the K&N Filter in the Spectre CAI.

I changed my test method for these runs — same test route, but instead of starting from a stop, I started from a roll with the transmission manually selected to 2nd gear.  My thinking was that this would be less stress on the tires/drivetrain, and give better low rpm torque readings.

kn 2013-05-24 three run comparison cold locked 2nd pulls

The results are not what I expected.  We were looking for 376-380 whp so that part seems in range, with one runs at 384-388 whp.  The one run at 350 whp is odd.  The torque readings in general don’t seem to take the form one would expect.

kn 2013-05-24 hptuners

On the ‘green’ run in Virtual Dyno, I didn’t flip the transmission to auto-shift, so it redlined in 2nd gear getting to 6700+ rpm where the fuel cutoff is set.

Here is a similar graph with a previous 2nd gear sliced out of a 0-60 run compared with one of the runs from today:

kn 2013-05-24 cold to cold comparison

Red is today’s test; blue is a recent test in cool air with the Spectre filter in.  Today’s run appears to show much higher low end torque, and lower high end HP peak.

Next I will take the K&N filter off, check the installation, and re-install to see if there is something physical I am missing here.  Then I will re-oil the now cleaned Spectre and re-install it for testing.