Virtual Dyno, Wheel HP, Calculated Engine HP, and You #Motorama

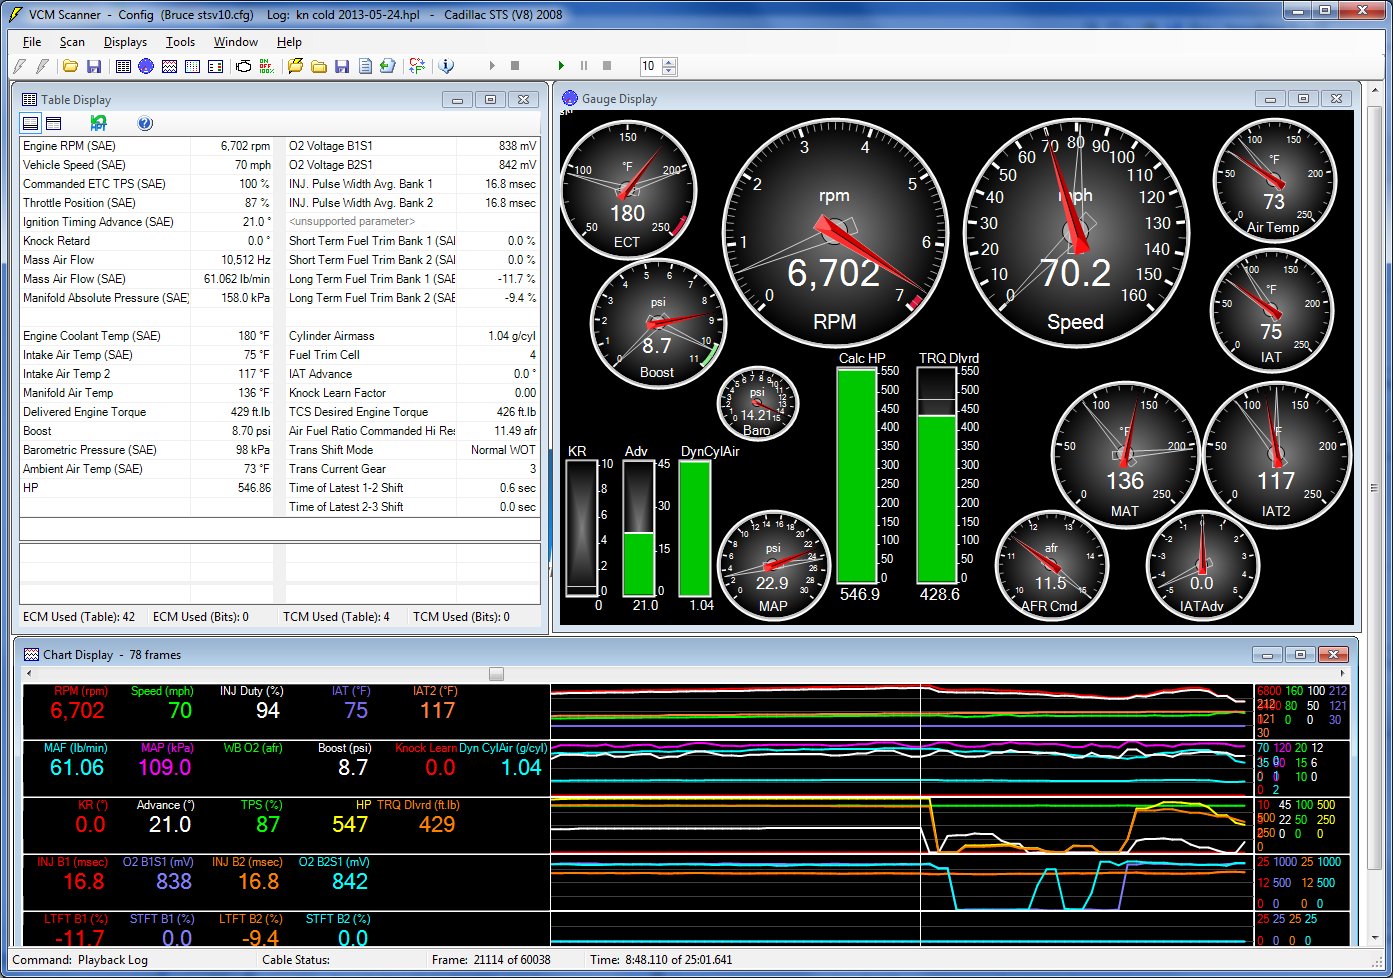
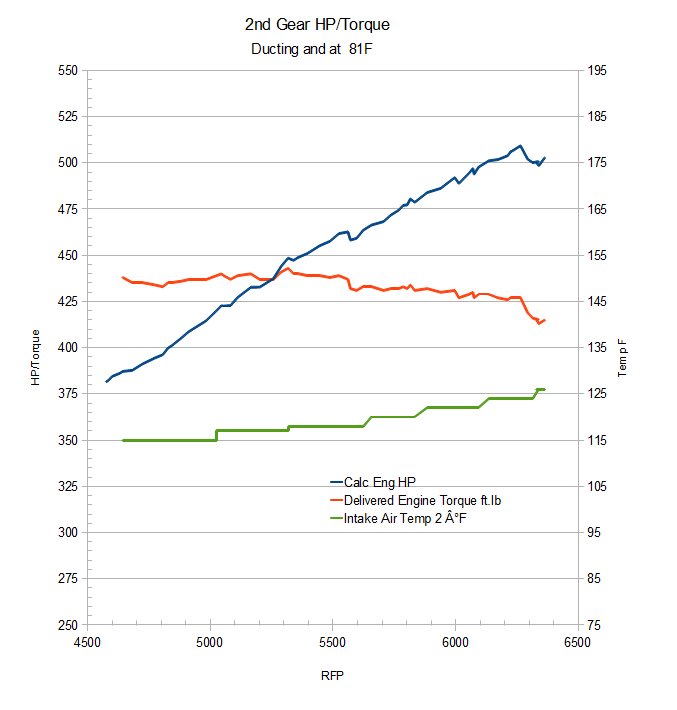
My Cadillac STS-V as most modern cars keeps up with how much torque the powertrain is delivering.  It uses this info to make adjustments in power delivery if needed.

Knowing the Delivered Torque, we can derive the Calculated HP, since we know the standard definition HP = (Torque x RPM)/5252

Engine RPM (SAE) rpm Delivered Engine Torque ft.lb Calc Engine HP
3564 423 287.05

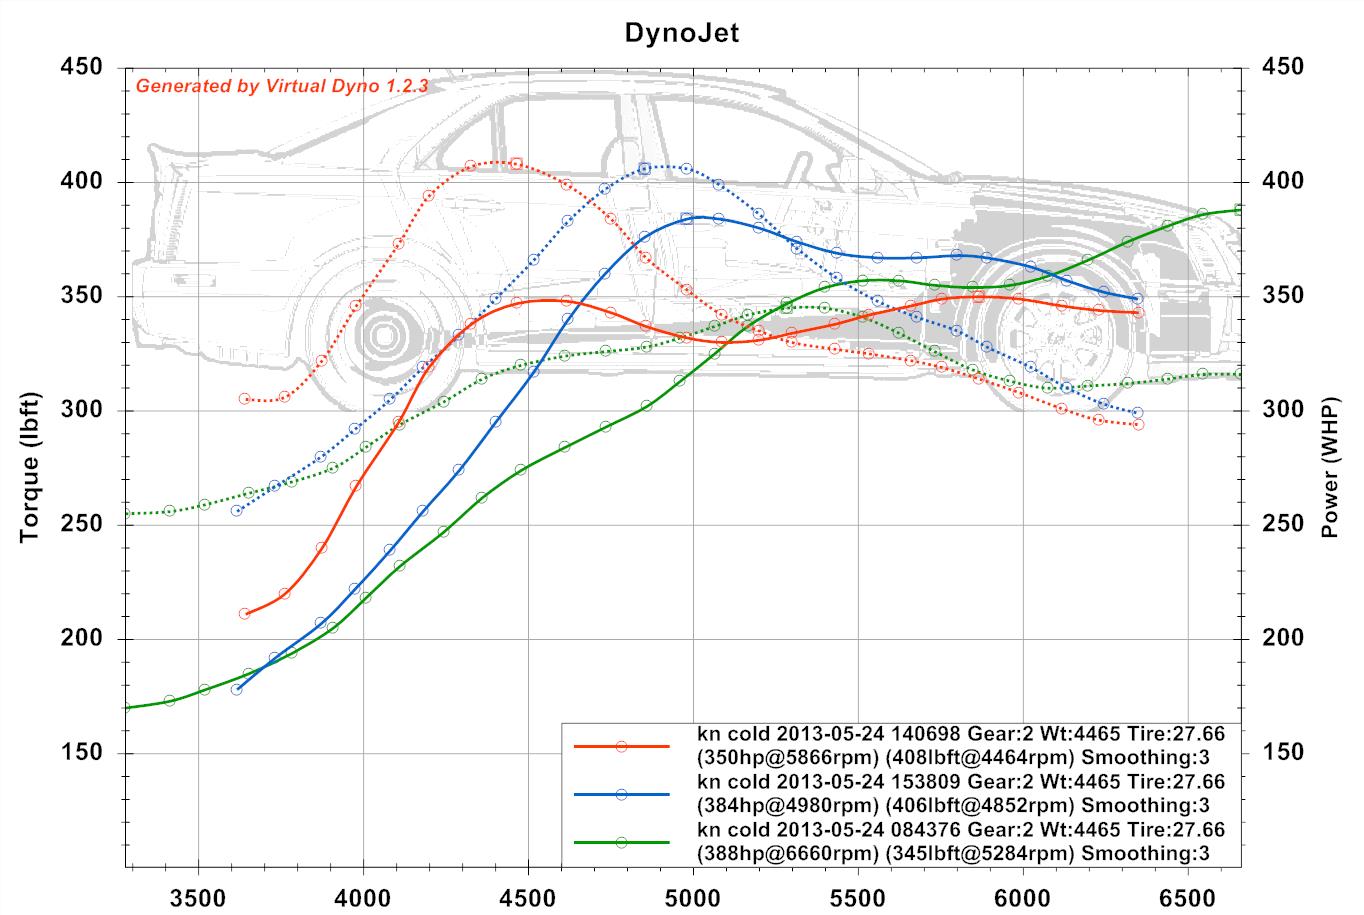
Virtual Dyno focuses on lovely HP/Torque graphs of power at the wheels, but of course is based on data tables which one can read from the graph node points.

Virtual Dyno WHP
RPM WHP
4489 272
4600 274
4693 278
4836 284

How do the Virtual Dyno wheel hp values relate to the engine’s calculated hp values for the same data run?

Delivered Torque to Virtual Dyno discussion

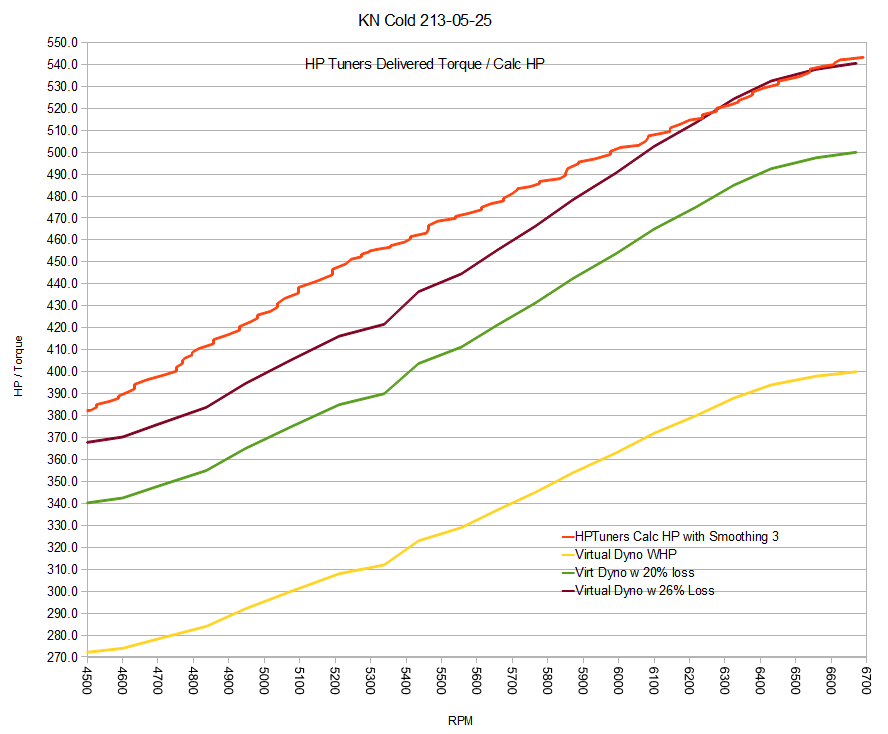
The Red line in this chart is the HPTuners Calculated HP.  I have applied smoothing 3, which is to say I have averaged the 3 prior and 3 following values at each point in order to smooth the graph.  The Yellow line is the Virtual Dyno wheel HP values for the exact same test run.

These two measure different things — the calculated hp is power at the crank; the Virtual Dyno is hp at the wheels.  We might expect them to differ by a standard dyno adjustment for transmission losses for automatic transmission vehicles, or 20%.  The Green line is the Virtual Dyno adjusted upwards to account for 20% transmission losses. Still not on top of the engine hp line.

The adjustment needed in this case is around 26%, which is the purple line (between the green and the red lines).  At high RPM this line overlays almost perfectly with the calculate engine HP line, and is closer at very low RPM, although not at mid-range values.

There are multiple sources of error and adjustment variables among these lines.

  • The engine uses a model to determine what makes engine power, which may or may not directly relate to more power at the wheels. I suspect it does relate closely to more power at the crank.
  • My test area is at 635 feet elevation, which is a 3% adder due to air density
  • In Dynojet mode, Virtual Dyno adds 9% to emulate a Dynojet result  — as a side note, I enjoyed this story on Dynojet development
  • Virtual Dyno uses car weight, driver weight, and weather entries.  If I am off on my entry it would effect the calculation.
  • Virtual Dyno is adjusting to SAE standard
  • It also uses vehicle coefficient of drag, and frontal area to adjust for wind resistance.  If I am off on these entries, or have a head-wind or tail wind, it would effect the calculation.

Now all these are normal issues to be dealt with, but the amazing thing I suppose is that it works at all — that we get meaningful data to gauge by.  My purpose for exploring these issues in this article was to get a handle on how the Virtual Dyno result differed from the Delivered Torque.

A short summary might be the STS-V has transmission losses of 22-24% and I am at the equivalent of 3% elevation, so 25-27% losses and that is what we see in the data.  However, one purpose of the thumbrule of average transmission losses for an automatic of 20% and manual of 15% is to be able to compare dissimilar cars — and how much WHP the car is putting down is what matters for how the car moves.  So the long and the short of it is, the car is putting around 400 whp and this car may have to make 540+ hp to do that, but an ‘average’ competitor will be able to do that with 500 hp.

I tend to use both to gauge mods — if the delivered torque / hp go up, that’s good, and I confirm the same trend in Virtual Dyno to determine the benefit of a mod.

What do you think?  Any advice on how to remove any variables or better use the tools?


Re-test of K&N filter on Spectre CAI with Virtual Dyno

This morning I ran some cold comparison tests for the K&N Filter in the Spectre CAI.

I changed my test method for these runs — same test route, but instead of starting from a stop, I started from a roll with the transmission manually selected to 2nd gear.  My thinking was that this would be less stress on the tires/drivetrain, and give better low rpm torque readings.

kn 2013-05-24 three run comparison cold locked 2nd pulls

The results are not what I expected.  We were looking for 376-380 whp so that part seems in range, with one runs at 384-388 whp.  The one run at 350 whp is odd.  The torque readings in general don’t seem to take the form one would expect.

kn 2013-05-24 hptuners

On the ‘green’ run in Virtual Dyno, I didn’t flip the transmission to auto-shift, so it redlined in 2nd gear getting to 6700+ rpm where the fuel cutoff is set.

Here is a similar graph with a previous 2nd gear sliced out of a 0-60 run compared with one of the runs from today:

kn 2013-05-24 cold to cold comparison

Red is today’s test; blue is a recent test in cool air with the Spectre filter in.  Today’s run appears to show much higher low end torque, and lower high end HP peak.

Next I will take the K&N filter off, check the installation, and re-install to see if there is something physical I am missing here.  Then I will re-oil the now cleaned Spectre and re-install it for testing.

Air Ducting to CAI DIY Mod #Motorama

What benefit is there to routing air from the lower bumper to the cold air intake?

Spectre Performance 8746 Blue Air Duct Hose

I have a Spectre Cold Air intake on my 2008 Cadillac STS-V.  Today’s question is, what if we ducted cold air from the bumper to the CAI instead of to brake cooling as designed?

I shopped for this air duct by Spectre on Amazon.  It was available in a few colors, and the price differed by color, so I got the lower price blue one.

photo

This is a shot of the hose in the package as received.

photo2

The end pieces are rubber; the hose itself is plastic.  It stretches out like an accordion, and holds it shape once adjusted.

photo3

The coupler for the ducting is tucked into the brake cooling duct.  It is a press-tight fit, but I will keep an eye on it and see if it stays in place at speed.  I tested up to 45 mph or so and it was still there.  I would prefer to put a inner locking ring or similar to ensure it stays in place at speed.

The inner diameter of the brake duct on the Cadillac is larger than the outer diameter of the coupler on the ducting.  A 3.5″ diameter duct might be a better fit here.

photo4

This shot is looking down past the filter into the top of the ducting.  This is where the incoming air will blow out of the hose and onto the air filter.

Only had time and temperature for a short test run to make sure the ducting stayed in place.  I will be testing next available good weather day.  Stay tuned.

Do you have other hints or suggestions for this setup?

Update:

Ran a new baseline / test run this morning.  Weather was okay but ambient read 81F, and test area 76F.

2013-05-18 reset 1-2 added ducting

Virtual Dyno with 1st gear and 2nd gear together detected no improvement due to the new air ducting to the CAI.  The previous run Virtual Dyno vs HPTuners Delivered Torque Curve was at 379/345 hp/torque at the wheels.

comparison of virtual dyno runs

This shows a comparison of the two virtual dyno runs in 2nd gear side by side.  Technically 4 hp less for the ducted version.

hptuners more1-2 run 2013-05-18

HPTuners data shows perhaps a lower run-up in IAT2 max of 125F instead of 130F, but incoming air temp at speed would seem to have less impact on this — already cooler at that point.

comparison of maf readings

In an attempt to discern how to measure a difference, this chart shows the raw mass air flow coming into the intake.  This would show if we are presenting the engine with more air, regardless of what the engine is doing with it.  Although we might conclude given different days etc these are equivalent, it is notable that the ducted air is ahead of the unducted intake.

The ducting did stay in place through my test drive.  I plan to continue to test and evolve this setup.  I have a new replacement cone filter on the way also; mine is quite dirty.  I will put the new one on then clean this one and have it in standby.