Tuning VVT — Establishing a Baseline

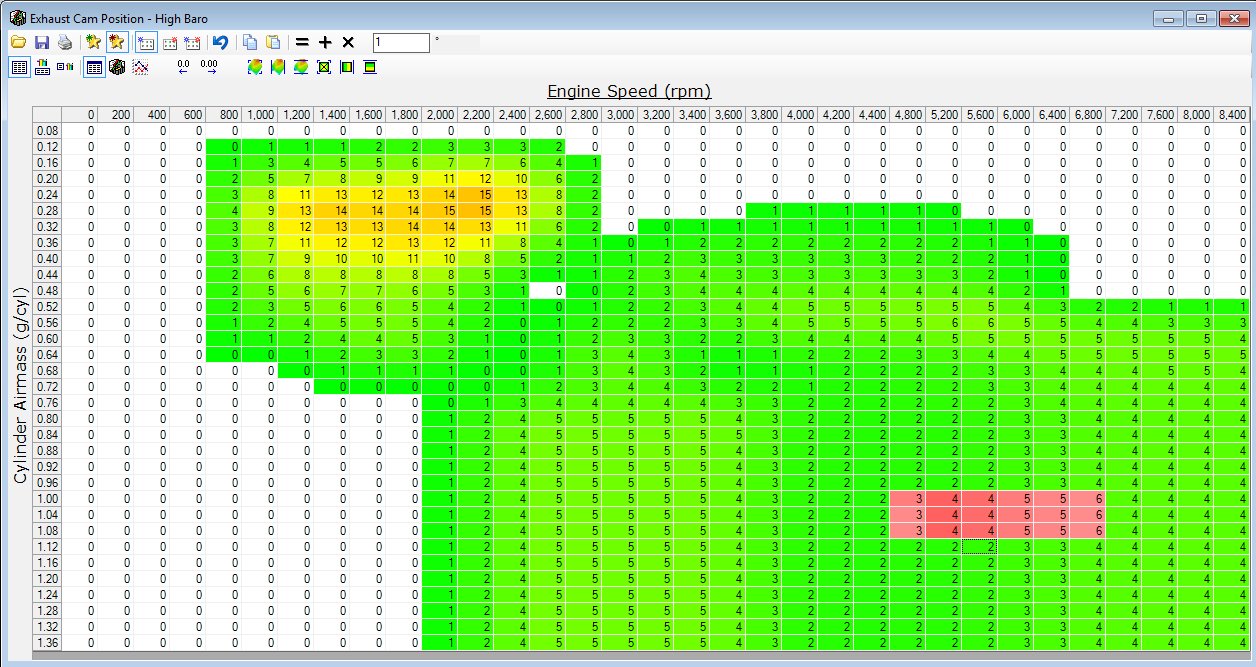
Variable valve timing allows tuning of the camshaft timing across the RPM range.  In my 2008 Cadillac STS-V, the DOHC engine allows individual tuning for exhaust and intake cams.

TUTD3  baseline hp torque vs boost sc vac

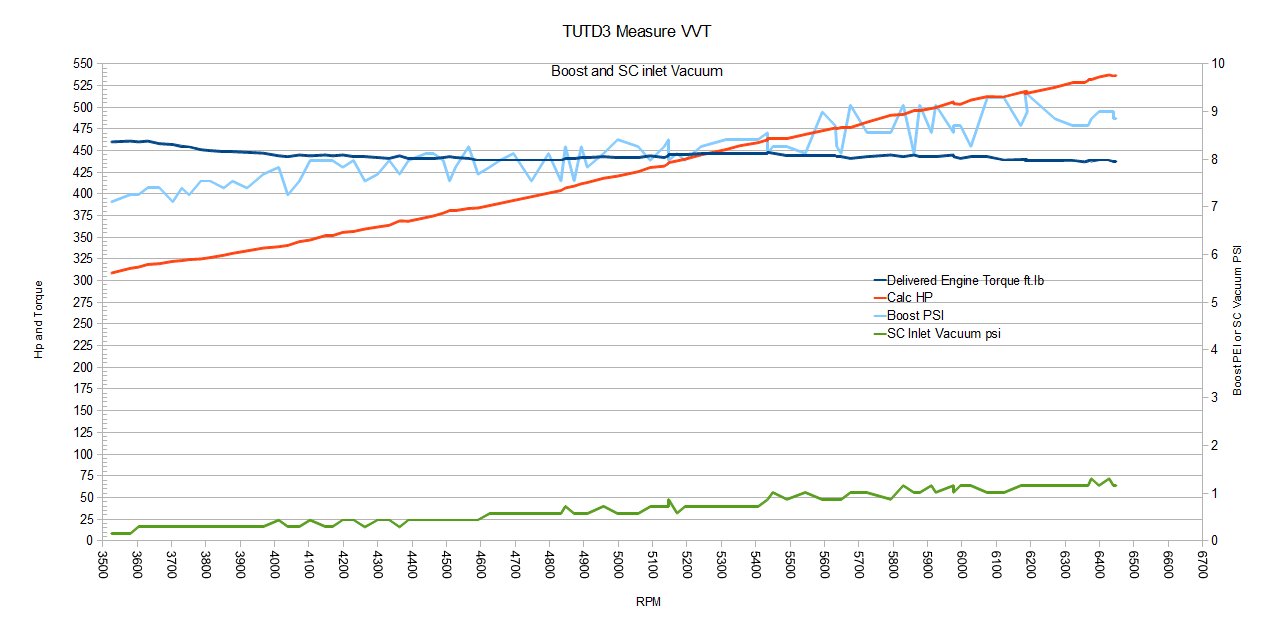
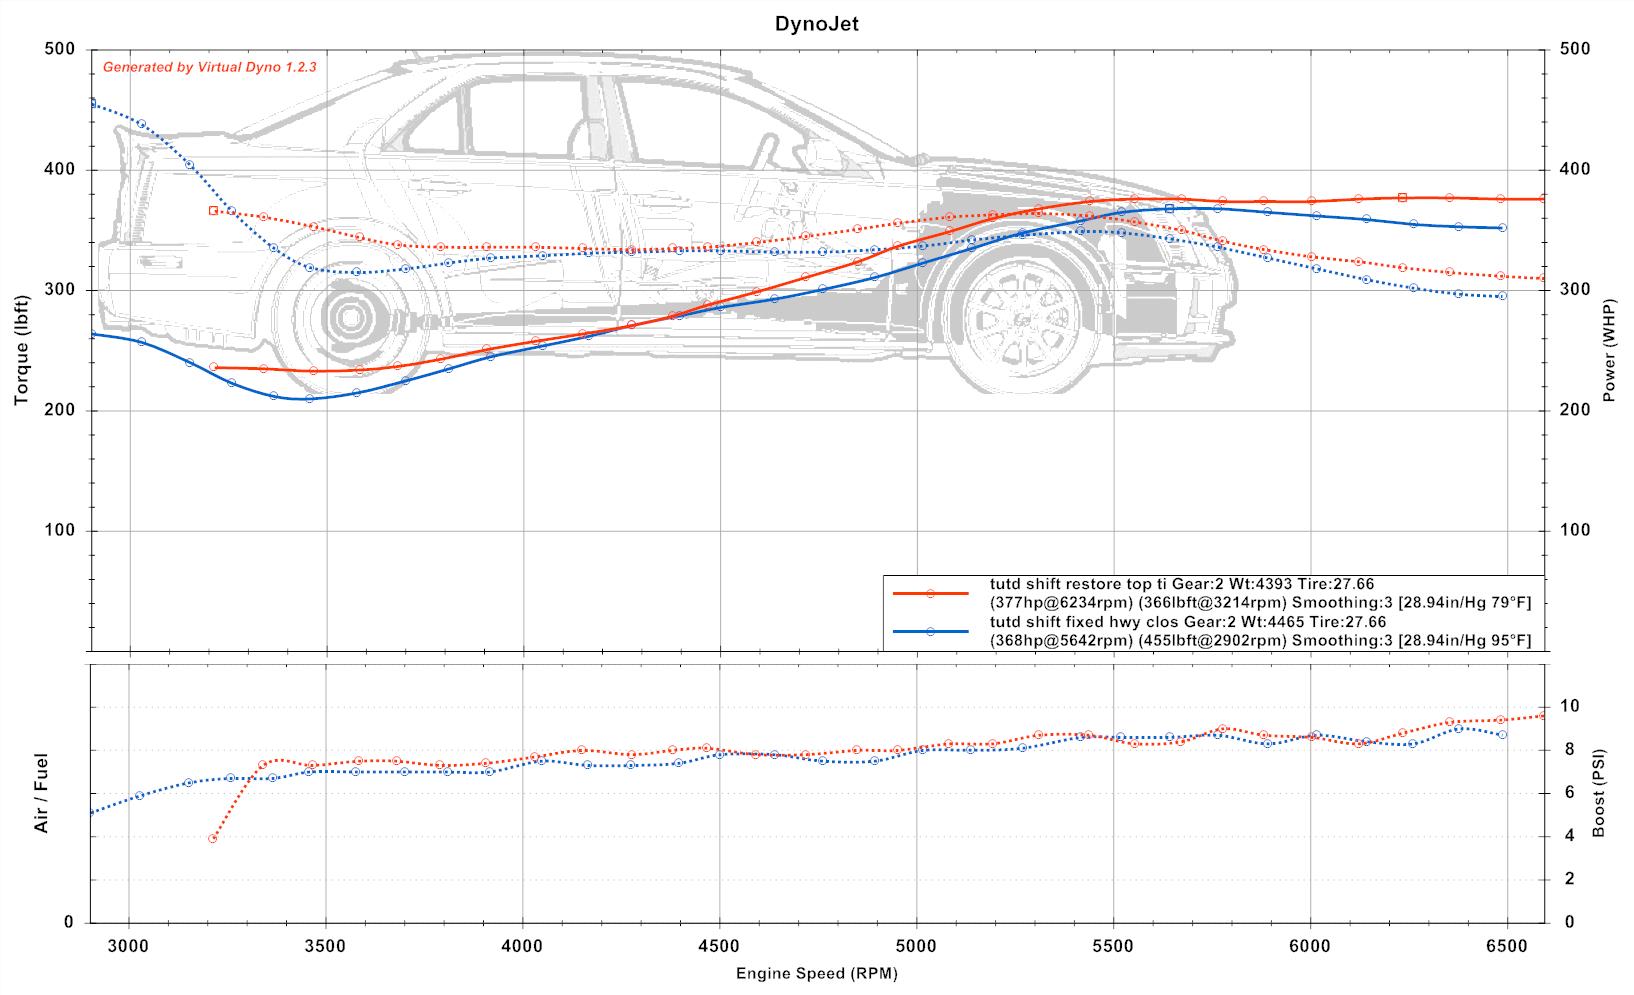
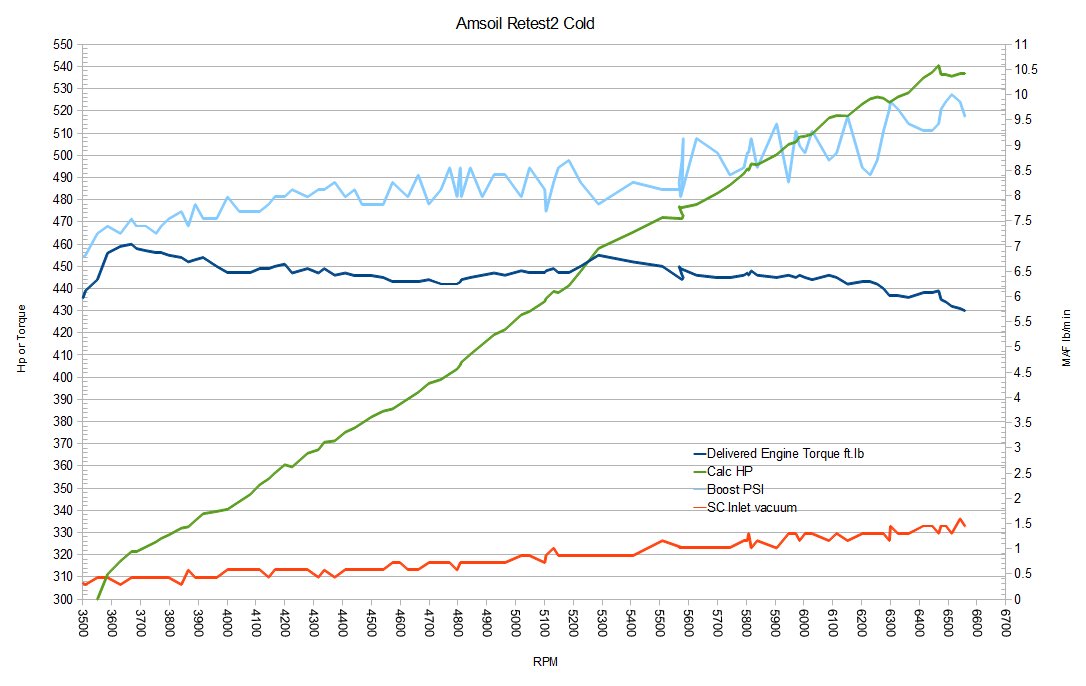
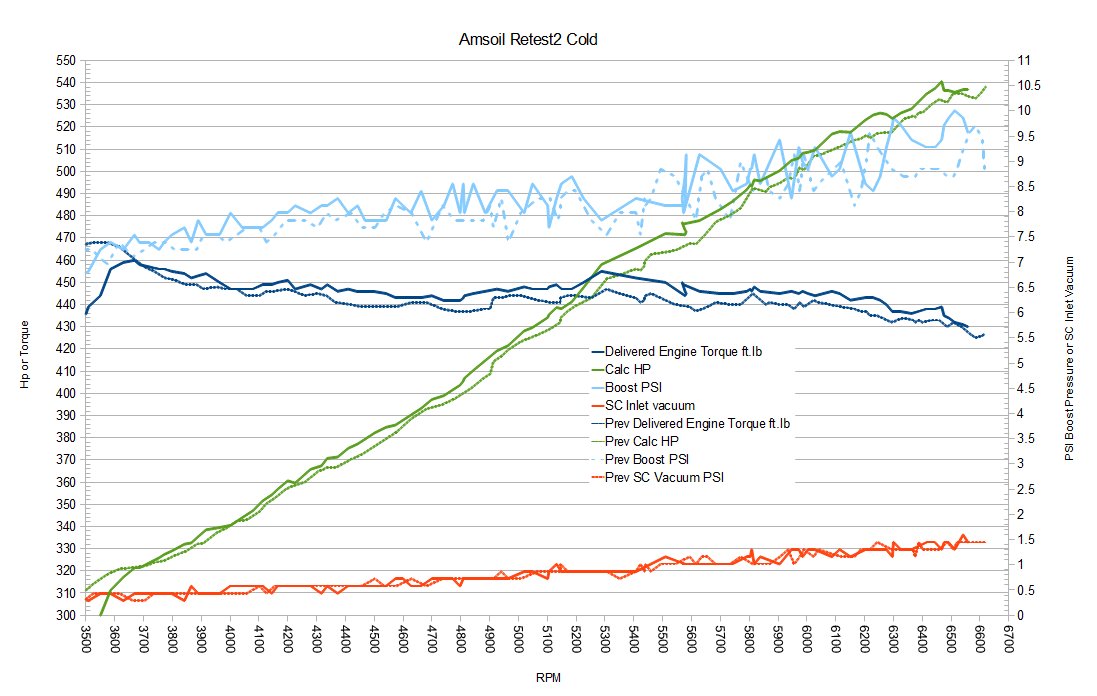
This graph shows today’s run delivered torque and calc hp vs supercharger boost and supercharger inlet vacuum in psi.  It is provided as a baseline comparison for how the engine performed today.

tutd 3 hptuners peak

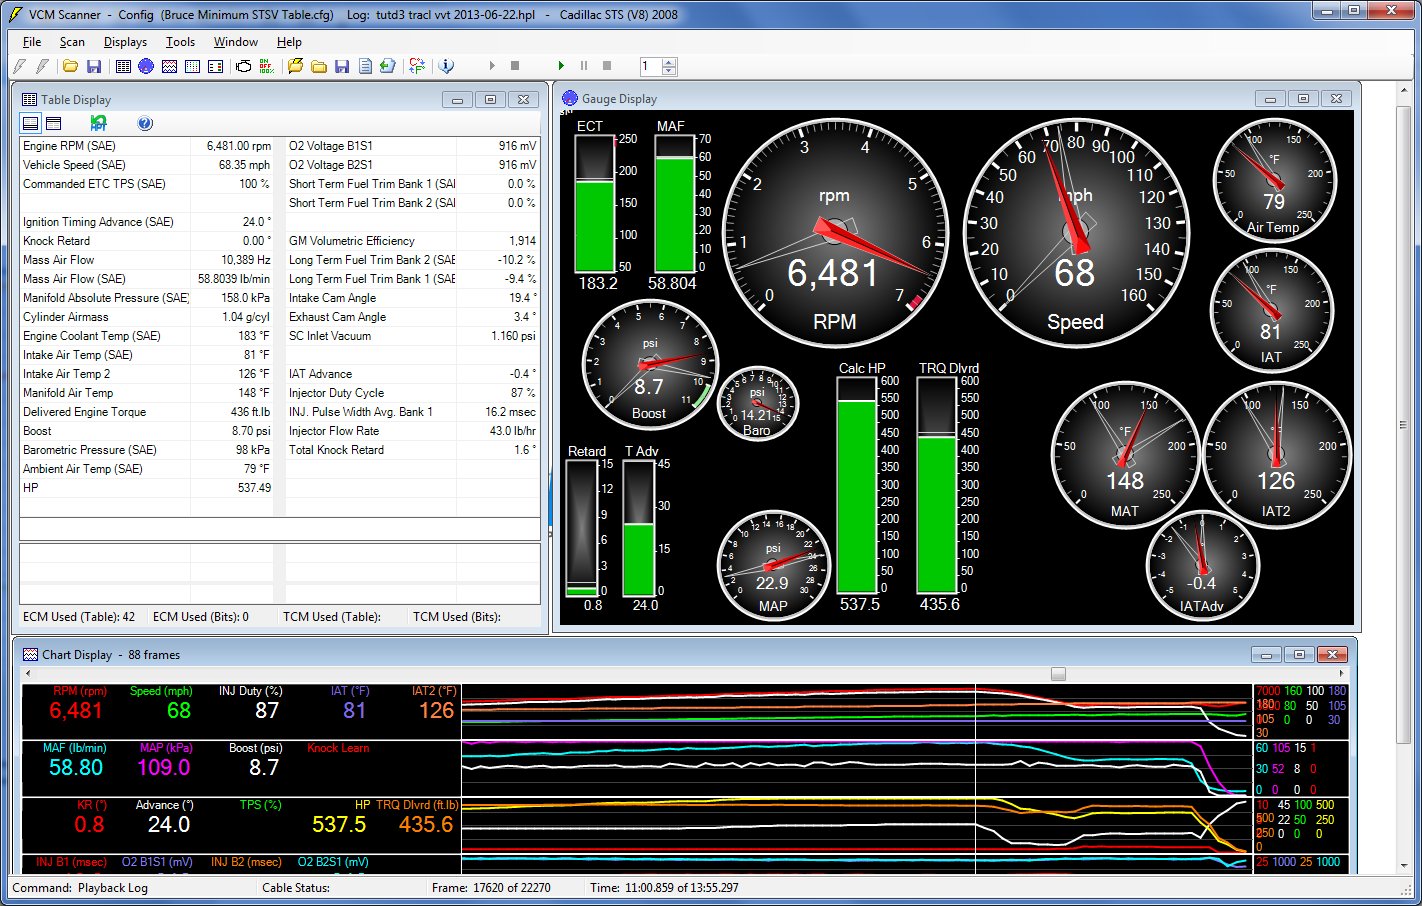
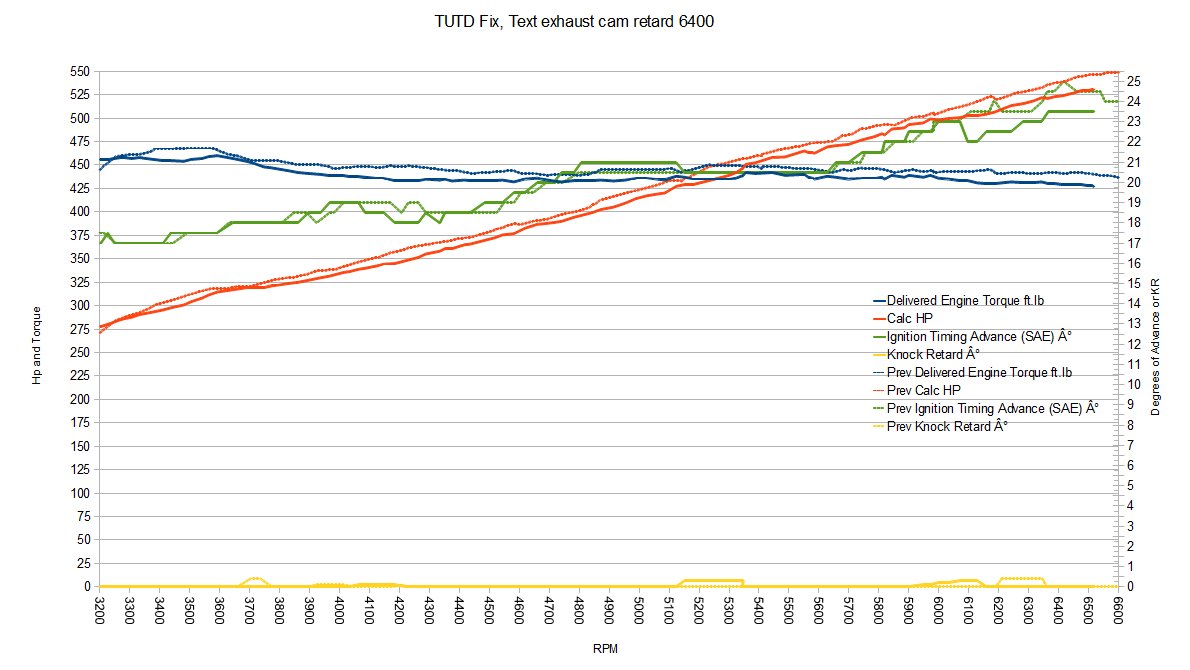
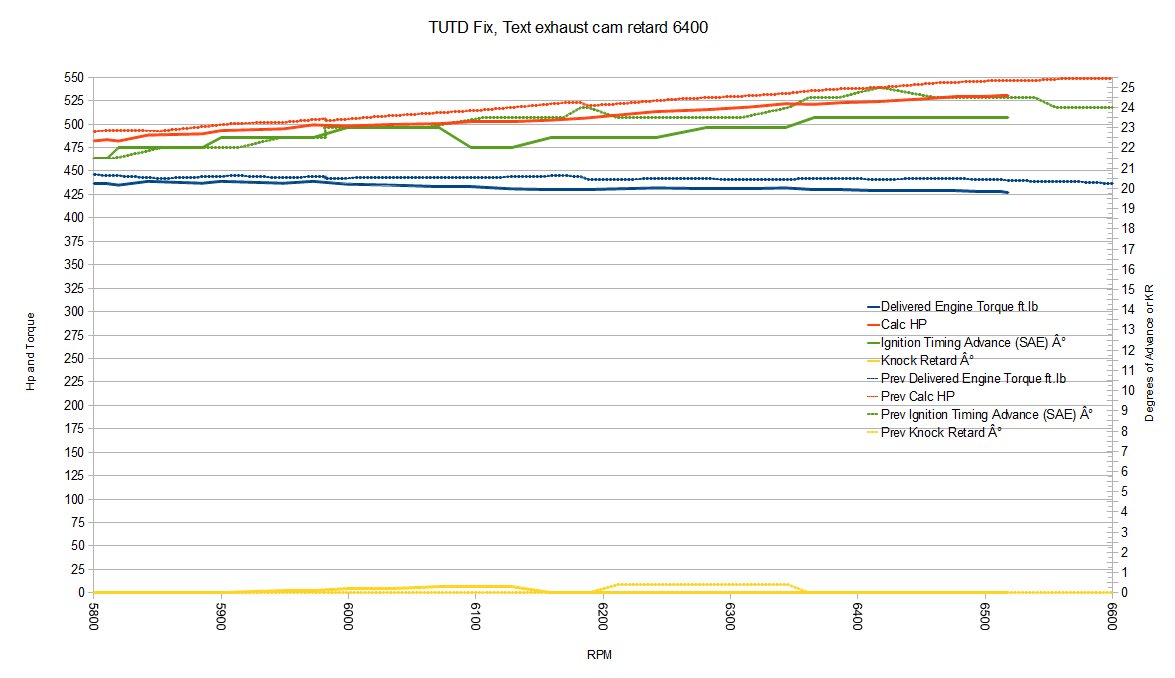
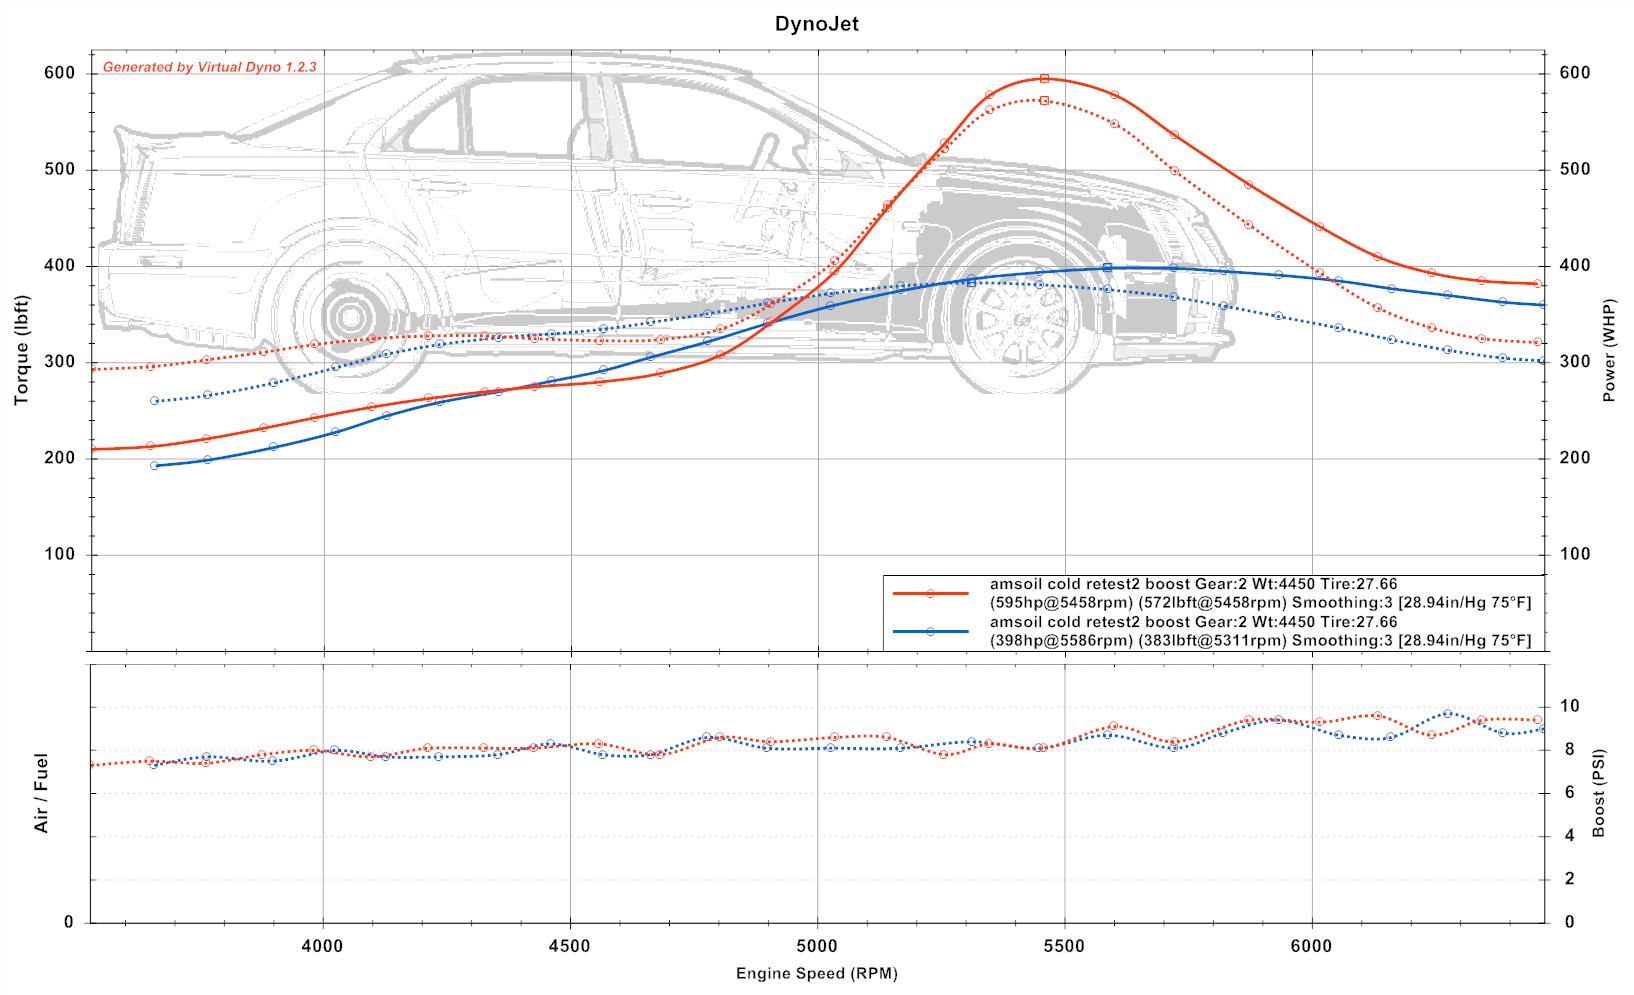
Hptuners capture at peak in 2nd gear.  This run shifted in custom TUTD mode at top of 2nd to allow selection of 2nd gear but smooth transition to 3rd.

TUTD3 KR vs total KR

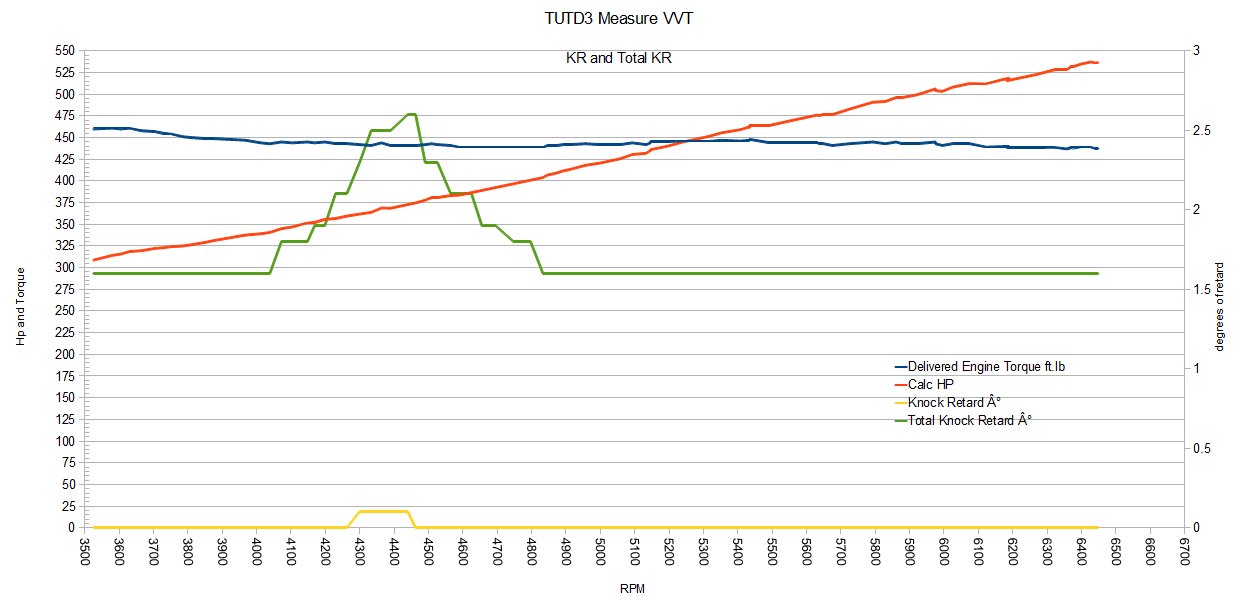
I have previously been charting KR, or knock retard.  I added tracking for Total KR, which includes burst, or pre-emptive knock retard.  The KR is shown in yellow, and the Total KR in green on this chart.  I think you can see the Total KR anticipate and over-shadow the KR, as well as the fact that the Total KR runs a degree of KR all the time, which was a surprise to me.  More thought and study needed here.

I also should note that my gauge for KR tracks the Timing Retard sensor, which seems to be different from just KR or Total KR.  Again, more study.

TUTD3 cam position

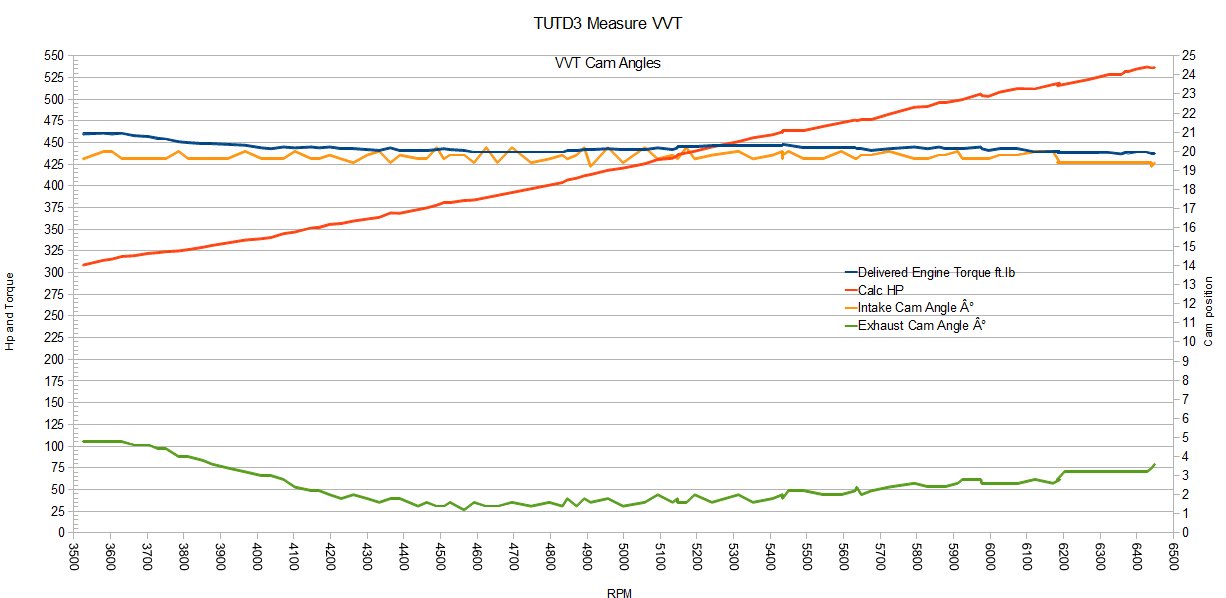
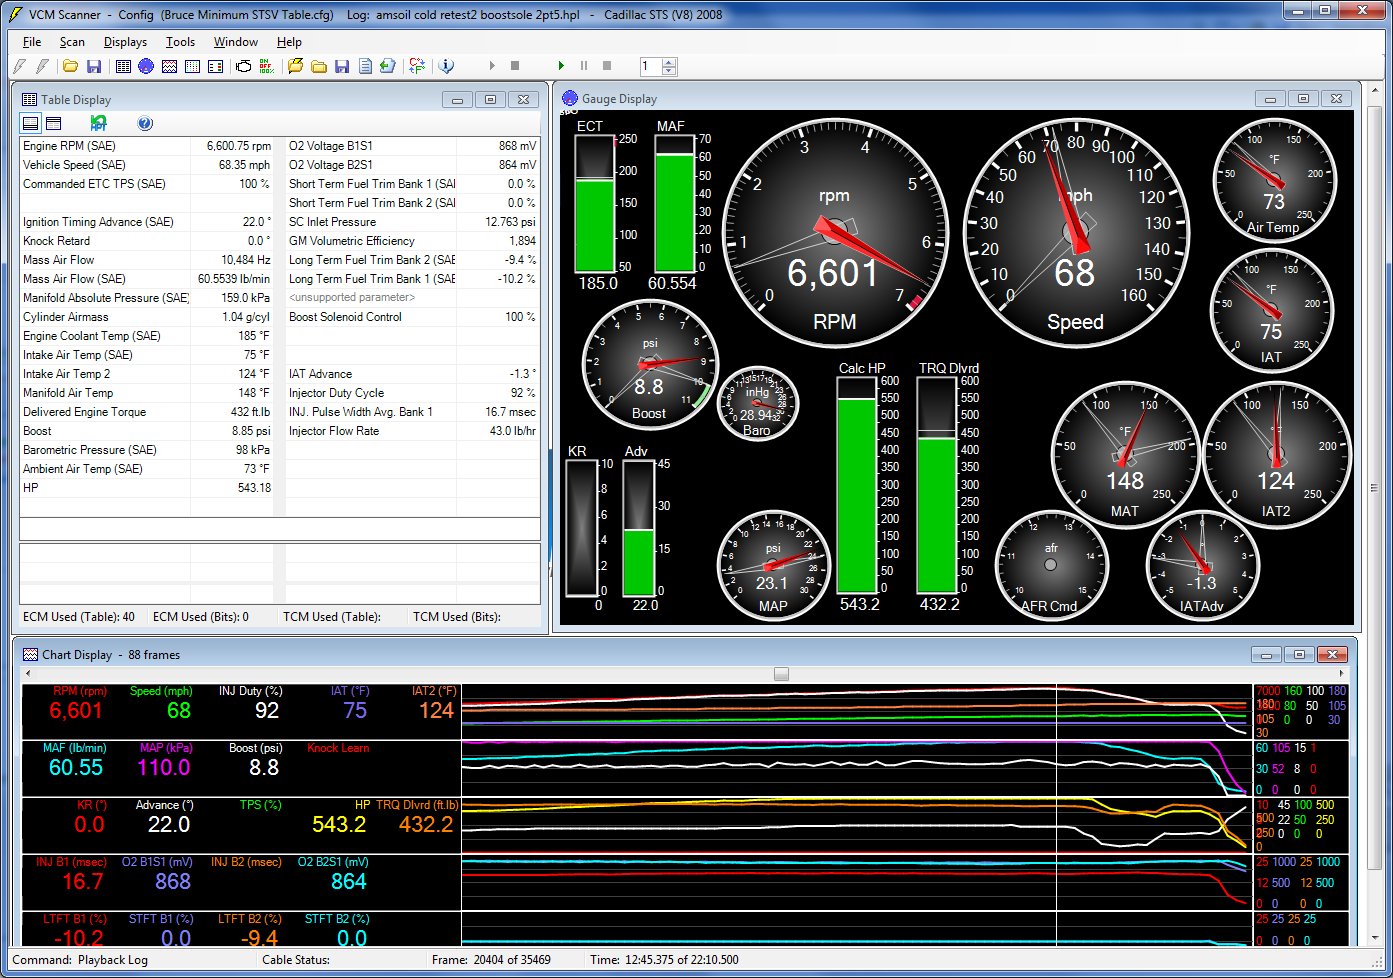
Finally, this graphic shows the VVT operation — the gold line is the intake cam position, and the green line is the exhaust cam position.  Basically, in the pressure range the V is running, the intake cam is commanded to 20 degrees, while the exhaust cam goes from 5 degrees at low RPM to 2 degrees midrange to 4 degrees at high RPM.

In our previous experiment, I changed the exhaust cam to show a more expected pattern similar to lower pressure settings by adding 1 degree at 4800 and 2 degrees of cam position from 5200 on.  We did not see a improvement or degradation, so it was reset it to OEM for this run.

It surprises me that the VVT cam position is not constant (waivers).  I am not sure if this is an effect of the variance in the boost, or if this is a cause of the variance in the boost.

TUTD3 2013-06-22 low virtual dyno result

I included a Virtual Dyno run.  Other than it is hotter now I am unclear why this run was markedly lower than prior.  Both are ‘cold’ runs at operating temp but without heat soak.  The MAF also shows less air in lb/min so I don’t think it is just test variance, but I am uncertain what caused.

TUTD3 RPM vs Time comparison

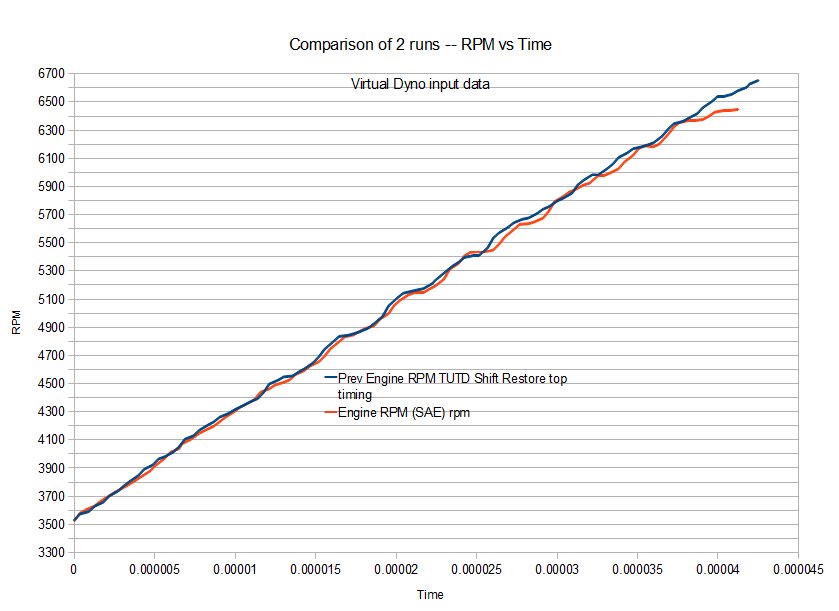
This graphic shows the raw data that Virtual Dyno uses — time deltas and RPM for the two runs shown.   The runs appear equivalent until 6300+ rpm, where today’s run tapers off.  This may be an effect of the TUTD shift for today’s run vs the hold to redline of previous run?

I will note that I got gas from an unusual location on last trip, not my normal source, but was marketed as 93 octane.

The boost psi looks similar between the two.  The good news is programming the TUTD to shift automatically avoids pulling the V back in to normal then back to sport, which appears to have been causing the RPM pattern that disrupted the virtual dyno readings.  The last few charts have not shown that issue.

 Summary

The purpose of today’s test was to select and record VVT cam positions over RPM to characterize current state with OEM tune.  Next I plan to study changes to the intake cam position.

Testing VVT Exhaust cam retard at high RPM

Today’s test was not a normal test.  First, I was dispatched for a breakfast run to Starbucks, which adds intercooler heat.  Second, the highway was jam packed with some problem, and the run was captured in an alternate location.  All that noted, I feel we can reach some conclusions.

TUTD 2013-06-21 exhaust cam test

This chart shows exhaust cam position for the VVT timing.  The cells in red are our test settings — adding 1 degree of retard at 4800 rpm, and 2 degrees of retard from 5200-6800.  What we hope to see is a change in the slope of the HP and Torque curves as a result.

tutd 2 2013-06-21 add exhaust cam retard

This chart shows today’s hotter run vs previous cooler run.   I am not focused on the absolute values so much as the slopes for today’s study.  Here is a zoom in from 5800-6600:

TUTD 2 2013-06-21 zoom in to study slope

What this appears to show is that the change in the exhaust cam timing didn’t cause a huge improvement or loss in power and torque at 4800-6800.  However, the slow of the blue torque curves appears to suggest that the addition is overall not an improvement, since the current curve decreases over time in this range at a faster rate than the previous.

The TUTD shift point did work correctly for this test, so that change will help with future testing.

TUTD 2 2013-06-21 exhaust cam retard

Next I will restore the exhaust cam VVT timing, and test an adjustment of the intake cam vvt timing.

Retest2 Cold for Comparison and more RPM reversion oddity

Ran another cold test with the Amsoil eaau6065 filter.  More odd results from Virtual Dyno — although I see the issue in the data file, I just don’t know what is causing it.

Backstory:  I continue to test & tune my 2008 Cadillac STS-V with the 4.4L Supercharged VVT, DOHC V8.  Rated from the factory at 469 hp (350 kW; 476 PS) at 6400 rpm, 439 lb·ft (595 N·m) at 3900 rpm.  Goal: 440 whp or 550 hp.

Summary torque hp boost vacuum

and here is a comparison with the previous test results:

Comparison test to retest

Different days, so equivalent given the test method.

amsoil retest2 another odd run

Another odd result reflected in Virtual Dyno on the 1st (red) run.  I see the issue in the data file but I am uncertain if this reflects a data capture glitch, or an actual phenomena.  You can see the same issue in the Hp/Torque graphs above around 5500 rpm.  These are x-y graphs, so that divot near 5500 rpm means that the RPM built to 5600, then went back down to 5500, then up through to the shift point — all during wide open throttle.  I am unclear what is causing this.  The 2nd run at the same day same site is shown in blue; although it also shows a lower RPM hp peak it is much closer to the expected values.

amsoil retest hptuners 2013-06-16

I added a boost solenoid check to see if the boost solenoid was involved in the variance for the boost psi, but the solenoid remains at 100% duty throughout the scan.

Even on this ‘cold’ run, we are running into IAT2 retard of 1.3 degrees at redline, reducing total timing to 22 degrees.

Conclusion:

  • Continue to see occasional odd data around 5500.
  • Analysis of the delivered torque / hp appears to give a consistent method of determining progress in tuning.
  • Run to run variances appear to tie to the boost variances, which suggests that these may be actual changes and not sensor variances.
  • Max observed boost 9.7-10 PSI above 6300 RPM
  • Max MAF lb/min 60.5-61.5 lb/min
  • Injector Duty cycle 90-92%