Cadillac XLR LH2 Tuning – Tune 7B Less Timing low, Lean

I am glad that I am running 2 tests on every setting now, as I am seeing some variability.

[Click to zoom images, back to return]

XLR Tune 7B Hp Torque 2 runs

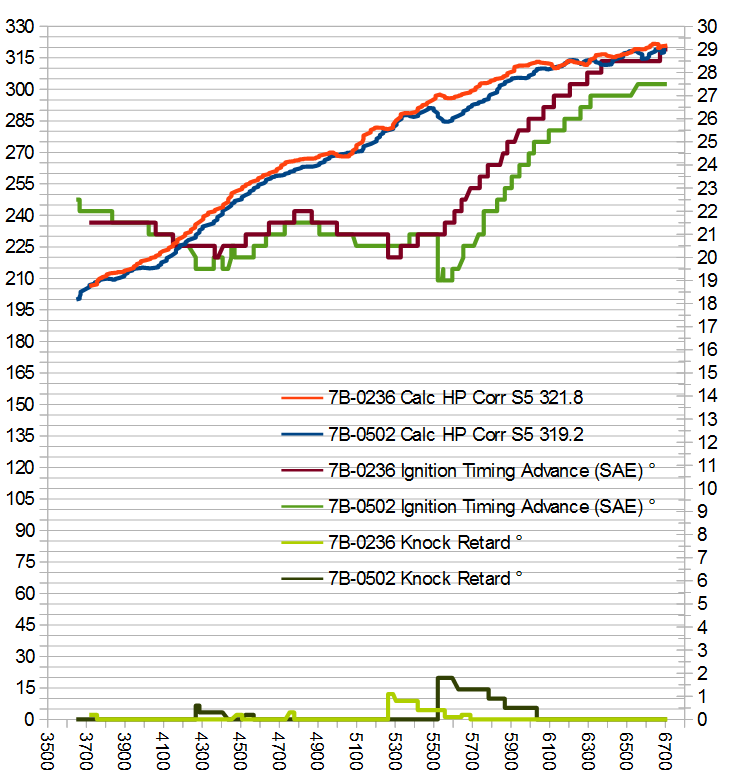
Tune 7B reduced the timing low, included some knock reserve where we were seeing KR, kept the timing high, and put piston protection back to 8192 instead of 6000 rpm.

Both the runs on the graph are tune 7B same day, same roadway, so same conditions.  The graph shows calculated HP at the top, degrees of advance in the middle, and degrees of KR at the bottom.  What happens is the 2nd run gets a knock event around 5500 rpm and loses 2 points of advance that it never seems to recover.

XLR Tune 7B run-to-run and 7A

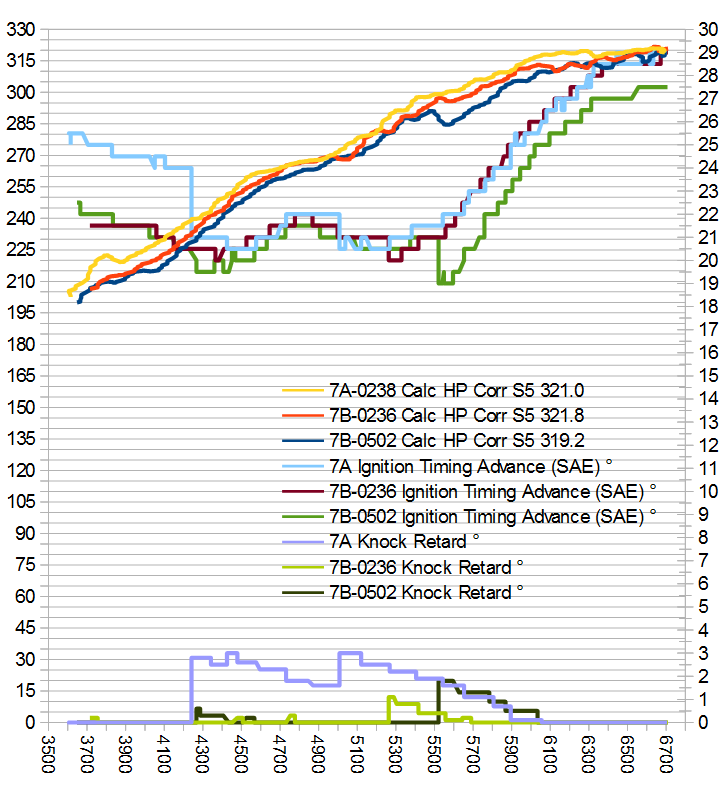
Throw in 7A as well, which had all the advance and a lot of KR, and you can see that 7B-0236 basically emulates 7A but via timing table not knock retard.

Tune 7B Virtual Dyno Compare w 7A 6G S3

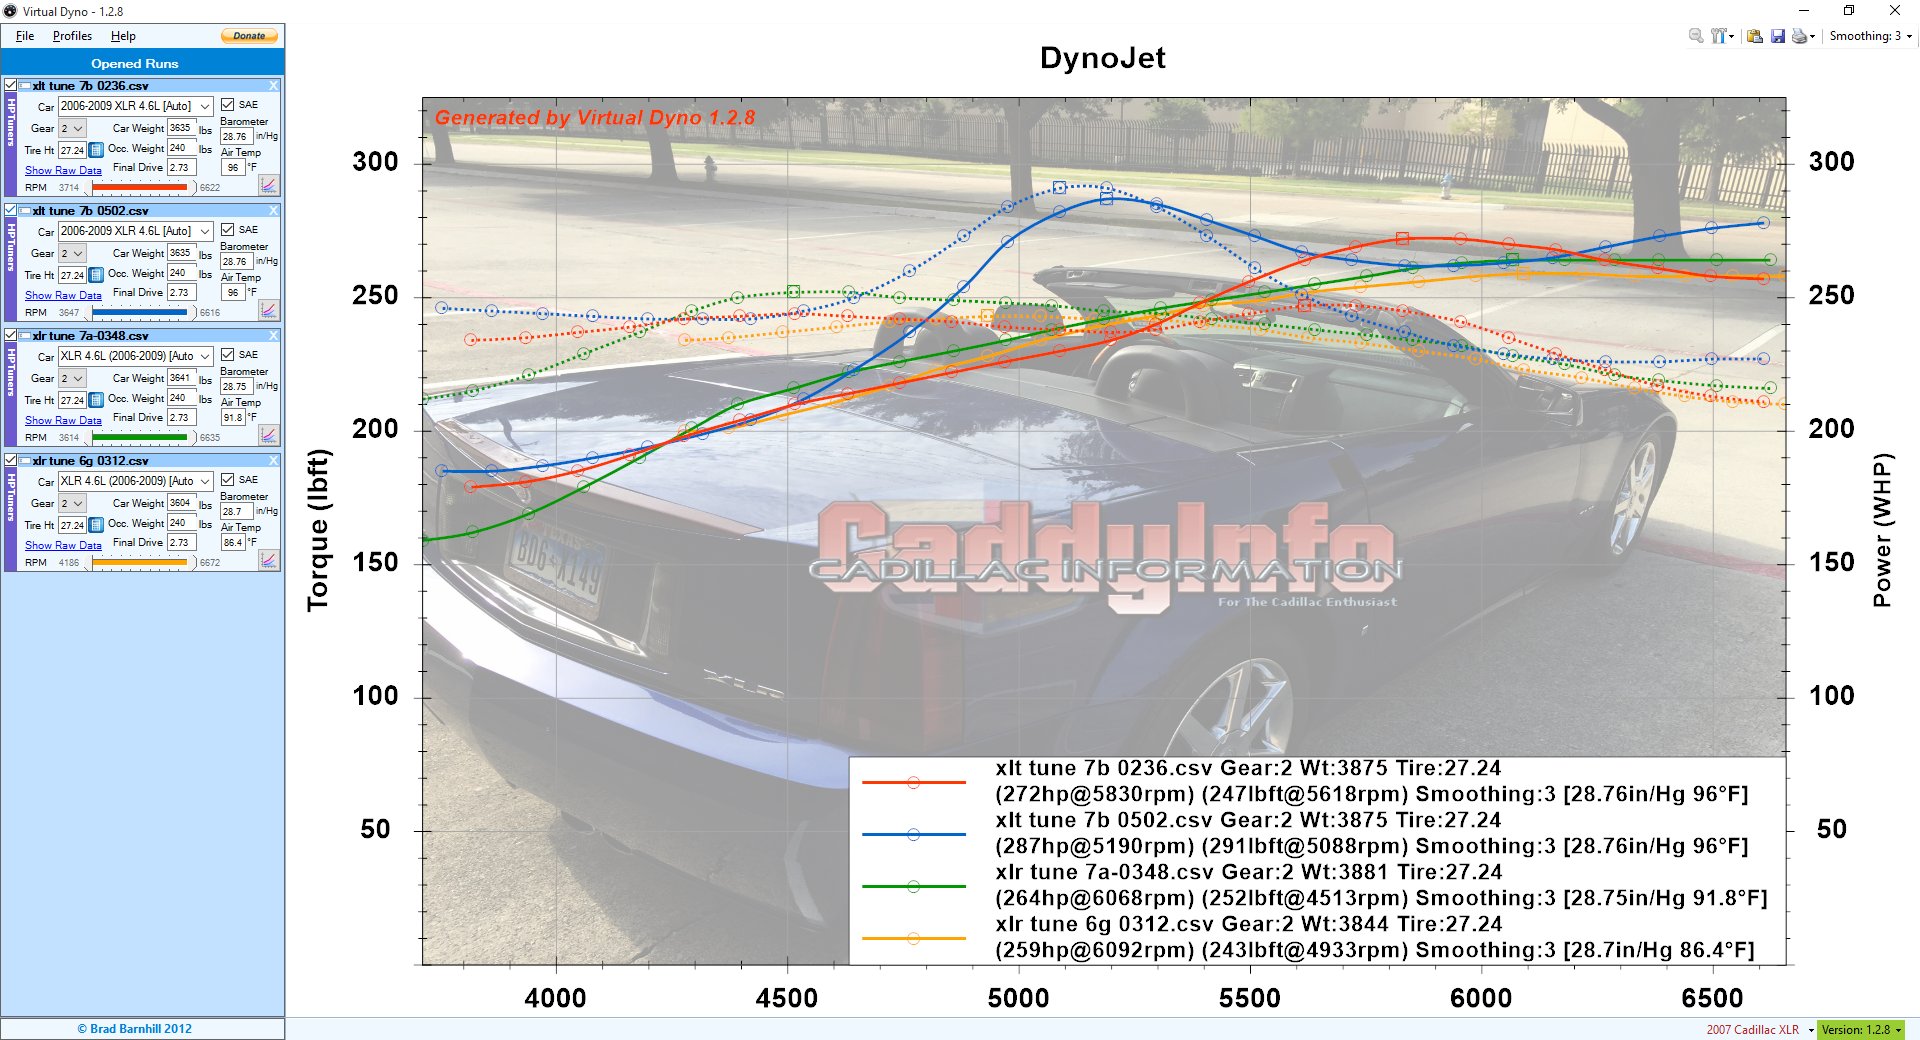
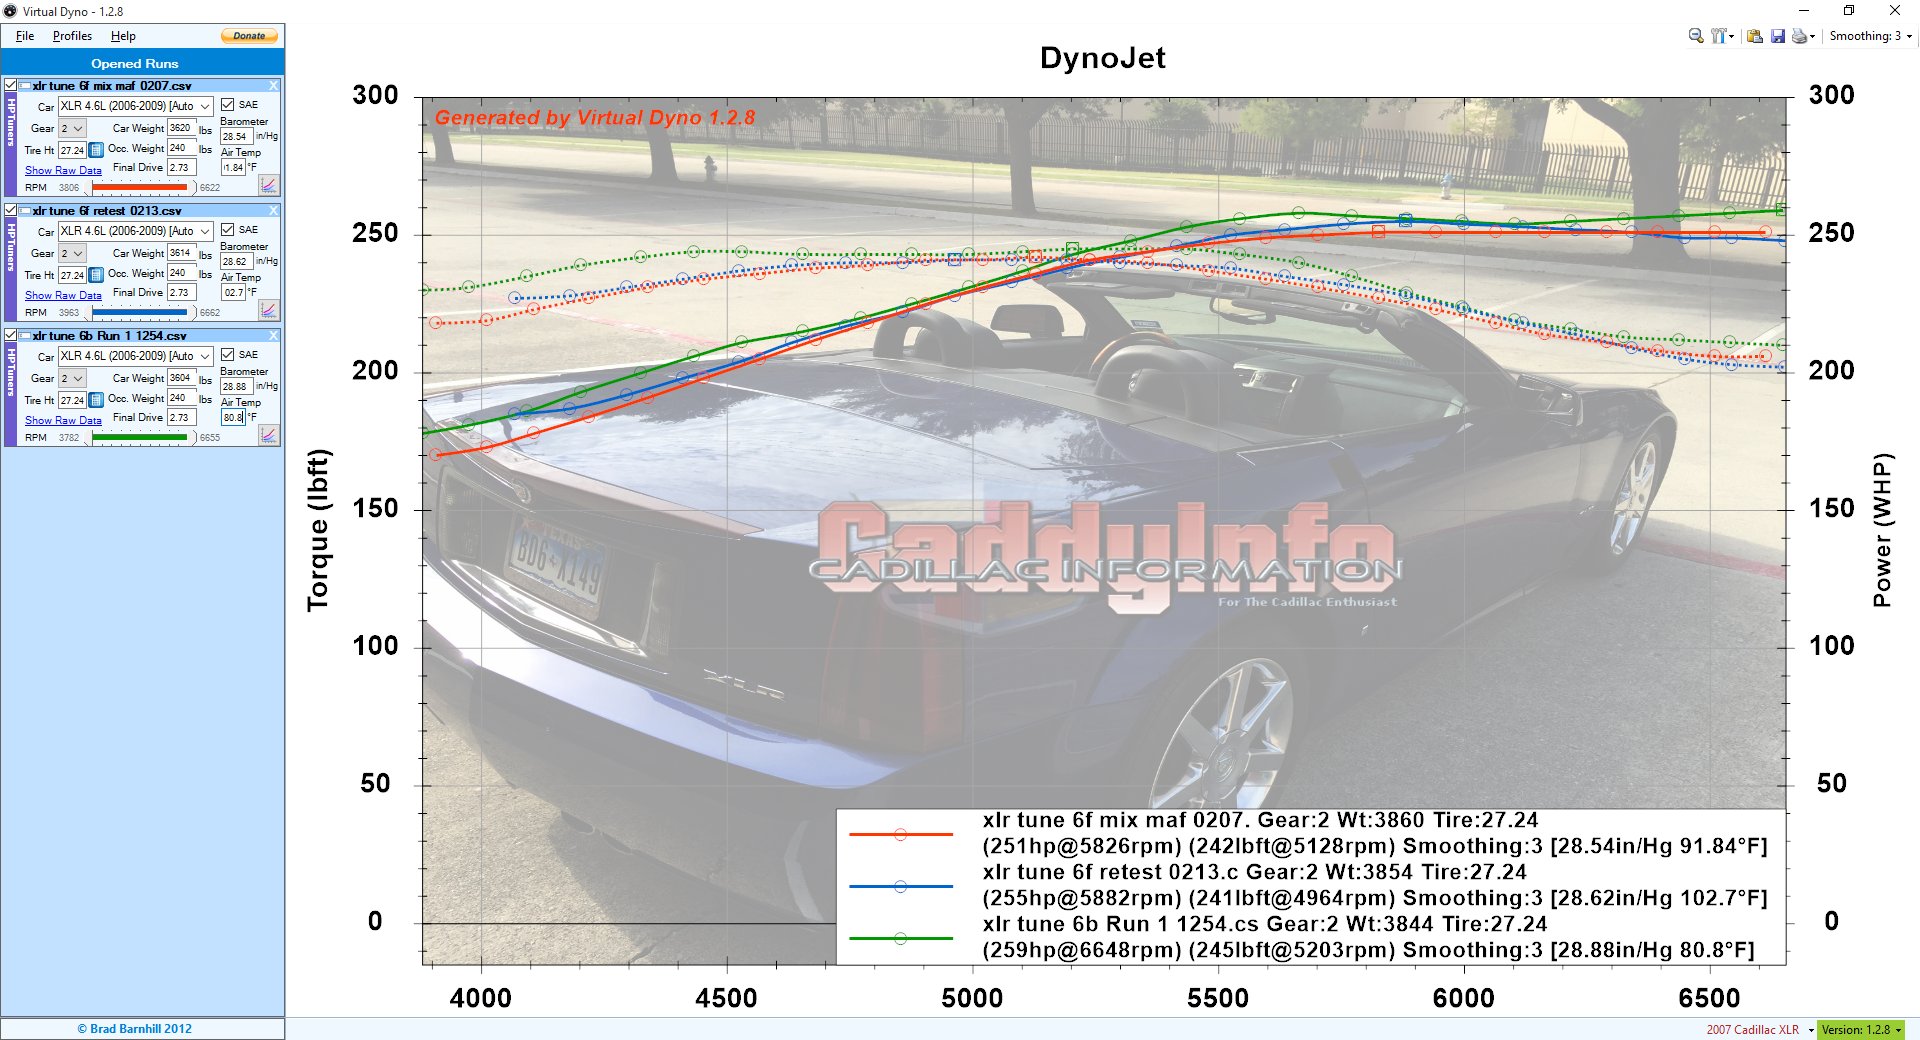
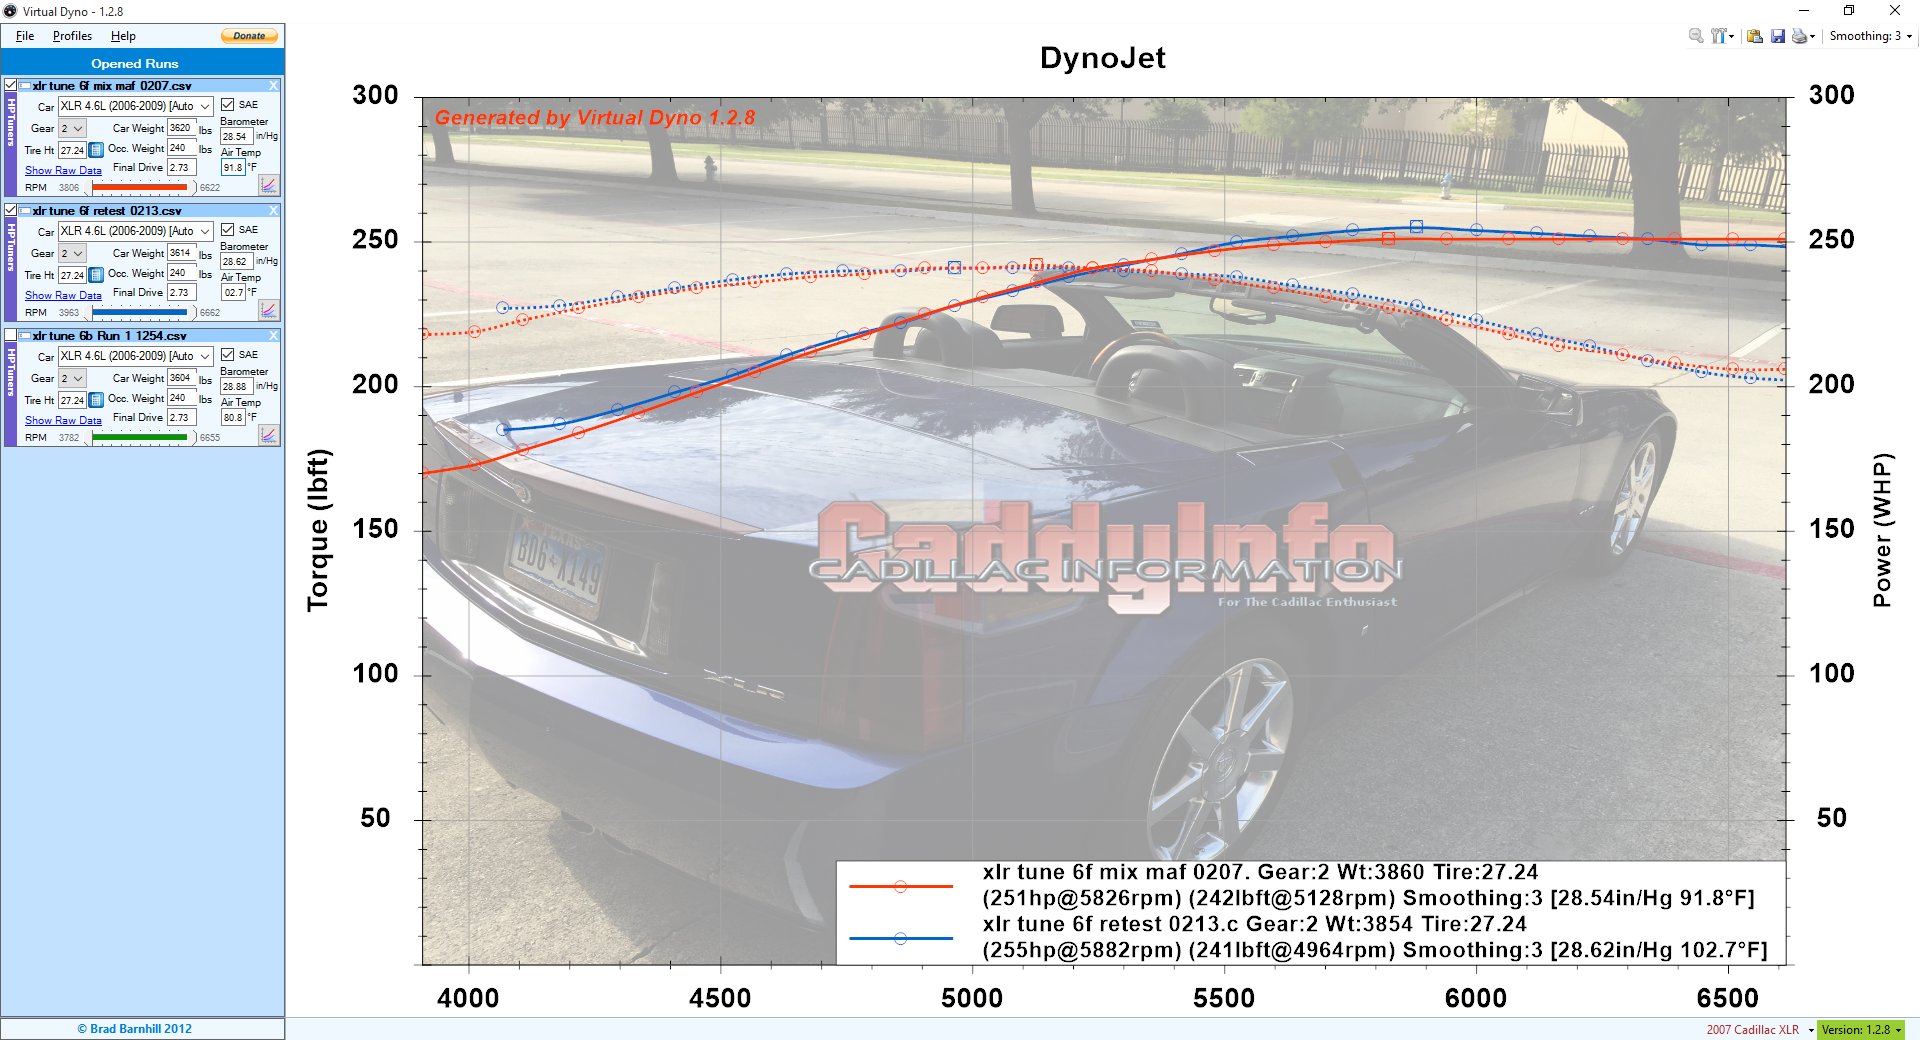
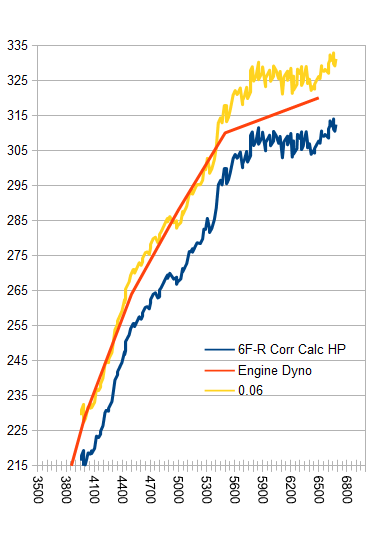
I am focusing on the calc HP/torque and not the Virtual Dyno for now, but the Virtual Dyno loved these tunes — except it shows some huge variability it could not smooth out.

XLR Tune 7B-0502 weather

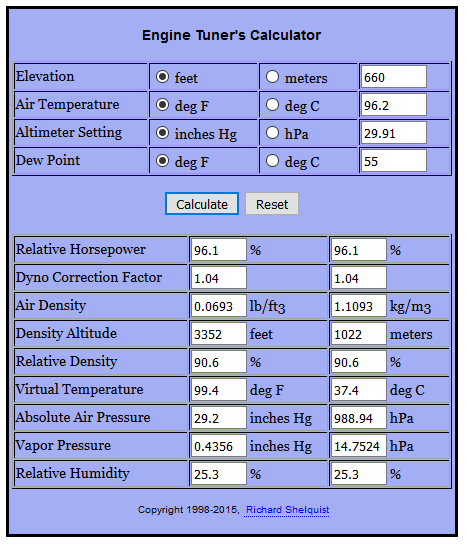
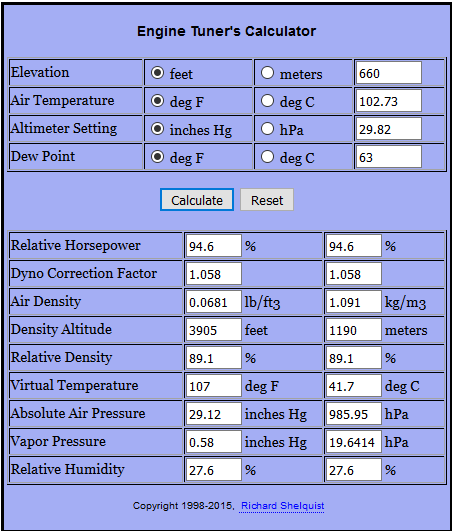
Weather Calc for 7B: https://wahiduddin.net/calc/calc_hp_dp.htm

I hope to gather more sample data for Tune 7B next.


Cadillac LH2 Engine Dyno Curve data table

As part of my ongoing tests for the LH2 VVT 4.6L V8 in my XLR I wanted more info than the published engine dyno from Cadillac offered.

XLR LH2 Virtual Dyno Plot vs Values

To build a data table, I took the image of the engine dyno, and overlaid a line graph over the image, then modified the data table for the line graph until it perfectly or closely followed the engine dyno graph.  You can see the spreadsheet line as dashed blue in the image.

Here is the resulting data table:

RPM LH2 Engine Dyno
1000 41
1500 75
2000 102
2500 131
3000 154
3500 188
4000 226
4500 264
5000 287
5500 306
6000 312
6400 320

Having more exact data from the engine dyno lets me compare it to the results I am seeing in detail:

XLR Tune 6G comparison to Virtual Dyno and Engine Dyno


Cadillac XLR LH2 V8 Tuning — Tune 6F Retest & Baseline

Tonight’s test was Tune 6F RETEST, a retest of the Tune 6F calibration to help build a baseline for comparison.  For the record, the VCM scanner froze, the XLR tilted, I used the code reader to reset, then the scanner worked properly and I ran the test.

XLR Tune 6F Retest compare with 6F and 6B

Tonight’s run is in BLUE. The comparison, same-calibration 6F is in RED.  The GREEN Tune 6B is the great first test after VVT Tune with the mid-hump.  Both 6F’s have the same tuning in that region.

XLR Tune 6F Retest Weather

Calculator: https://wahiduddin.net/calc/calc_hp_dp.htm

Weather: http://www.srh.noaa.gov/data/obhistory/KDFW.html

This is the calculator I am using to adjust for altitude, humidity, and temp.  Then I feed the dry-air absolute baro and test temp into Virtual Dyno.  This results in a close match :  the dyno correction is 1.058 above; the Virtual Dyno factor from uncorrected to corrected is also 1.058 with these changes for today’s conditions.

XLR Tune 6F RETEST only 6F Retest and 6F

The Tune 6F retest matches well with the Tune 6F test result, which is what we hope to see.  The peak is 4 whp different, but these are identical calibrations on different days.

XLR Tune 6F RETEST hptuners HP Peak

The Calculated hp peak in HP tuners for Tune 6F Retest was 295.7;  corrected that would be 295.7 x 1.058 = 312.9 hp in 2nd gear.  Next will be more runs with this tune to further characterize baseline after the Virtual Dyno profile issue.  What we want to see is when corrected for conditions, repetitive runs of the same tune show very close results.


XLR Tune 6F-R comparison with engine dyno

This chart is a comparison of Cadillac’s engine dyno result in red with the corrected calculated hp result from HPTuners in blue.  In my STS-V with a similar transmission the 2nd gear virtual dyno ran 6% less than my chassis dyno.  If that correction is also correct here, it (yellow) overlays the engine dyno plot up to 5400 rpm or so.