Cadillac XLR LH2 V8 Tuning — Tune 6F Retest & Baseline

Tonight’s test was Tune 6F RETEST, a retest of the Tune 6F calibration to help build a baseline for comparison.  For the record, the VCM scanner froze, the XLR tilted, I used the code reader to reset, then the scanner worked properly and I ran the test.

XLR Tune 6F Retest compare with 6F and 6B

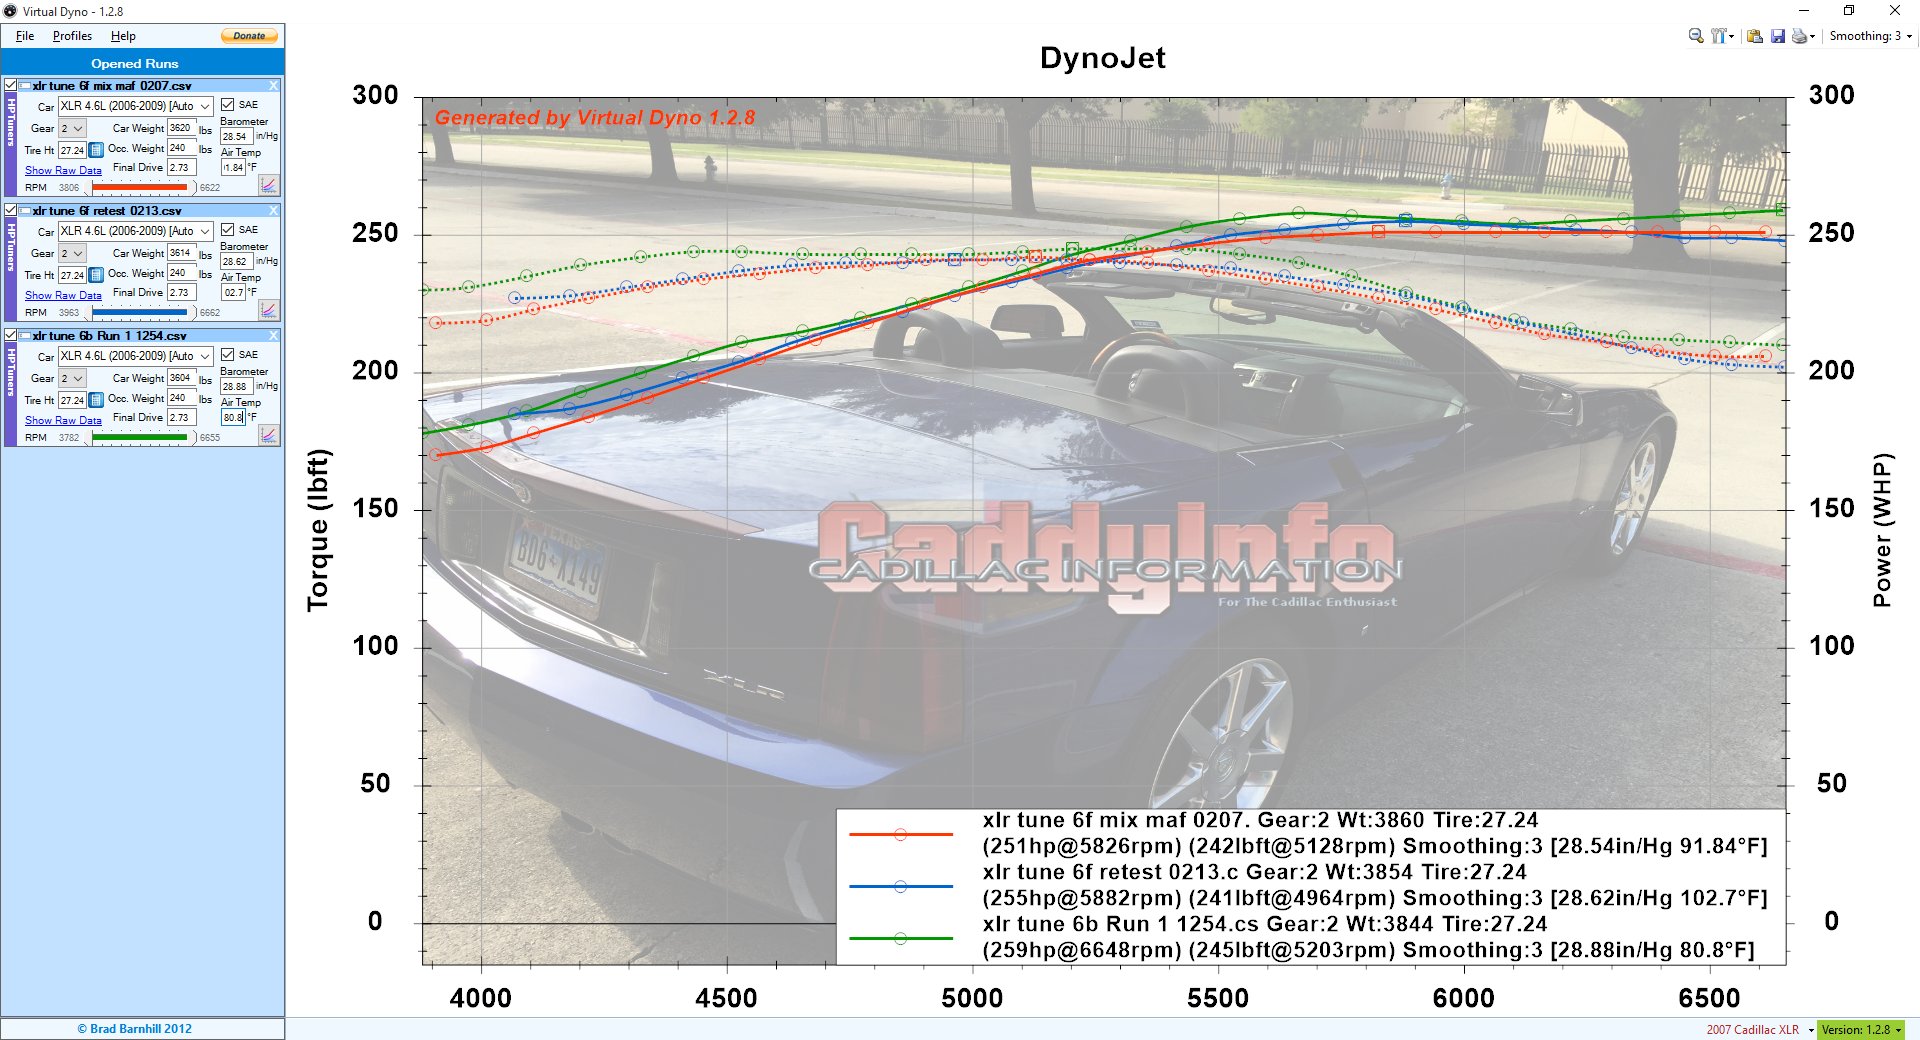
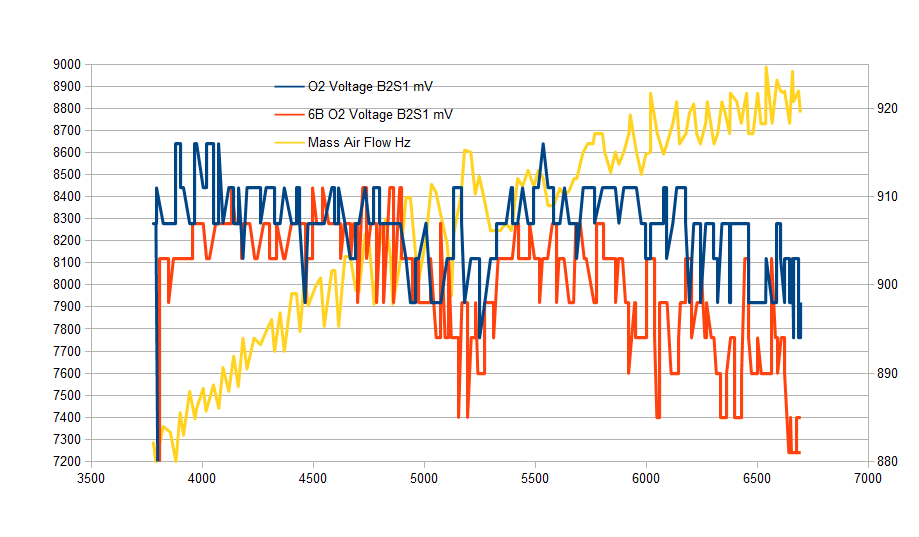
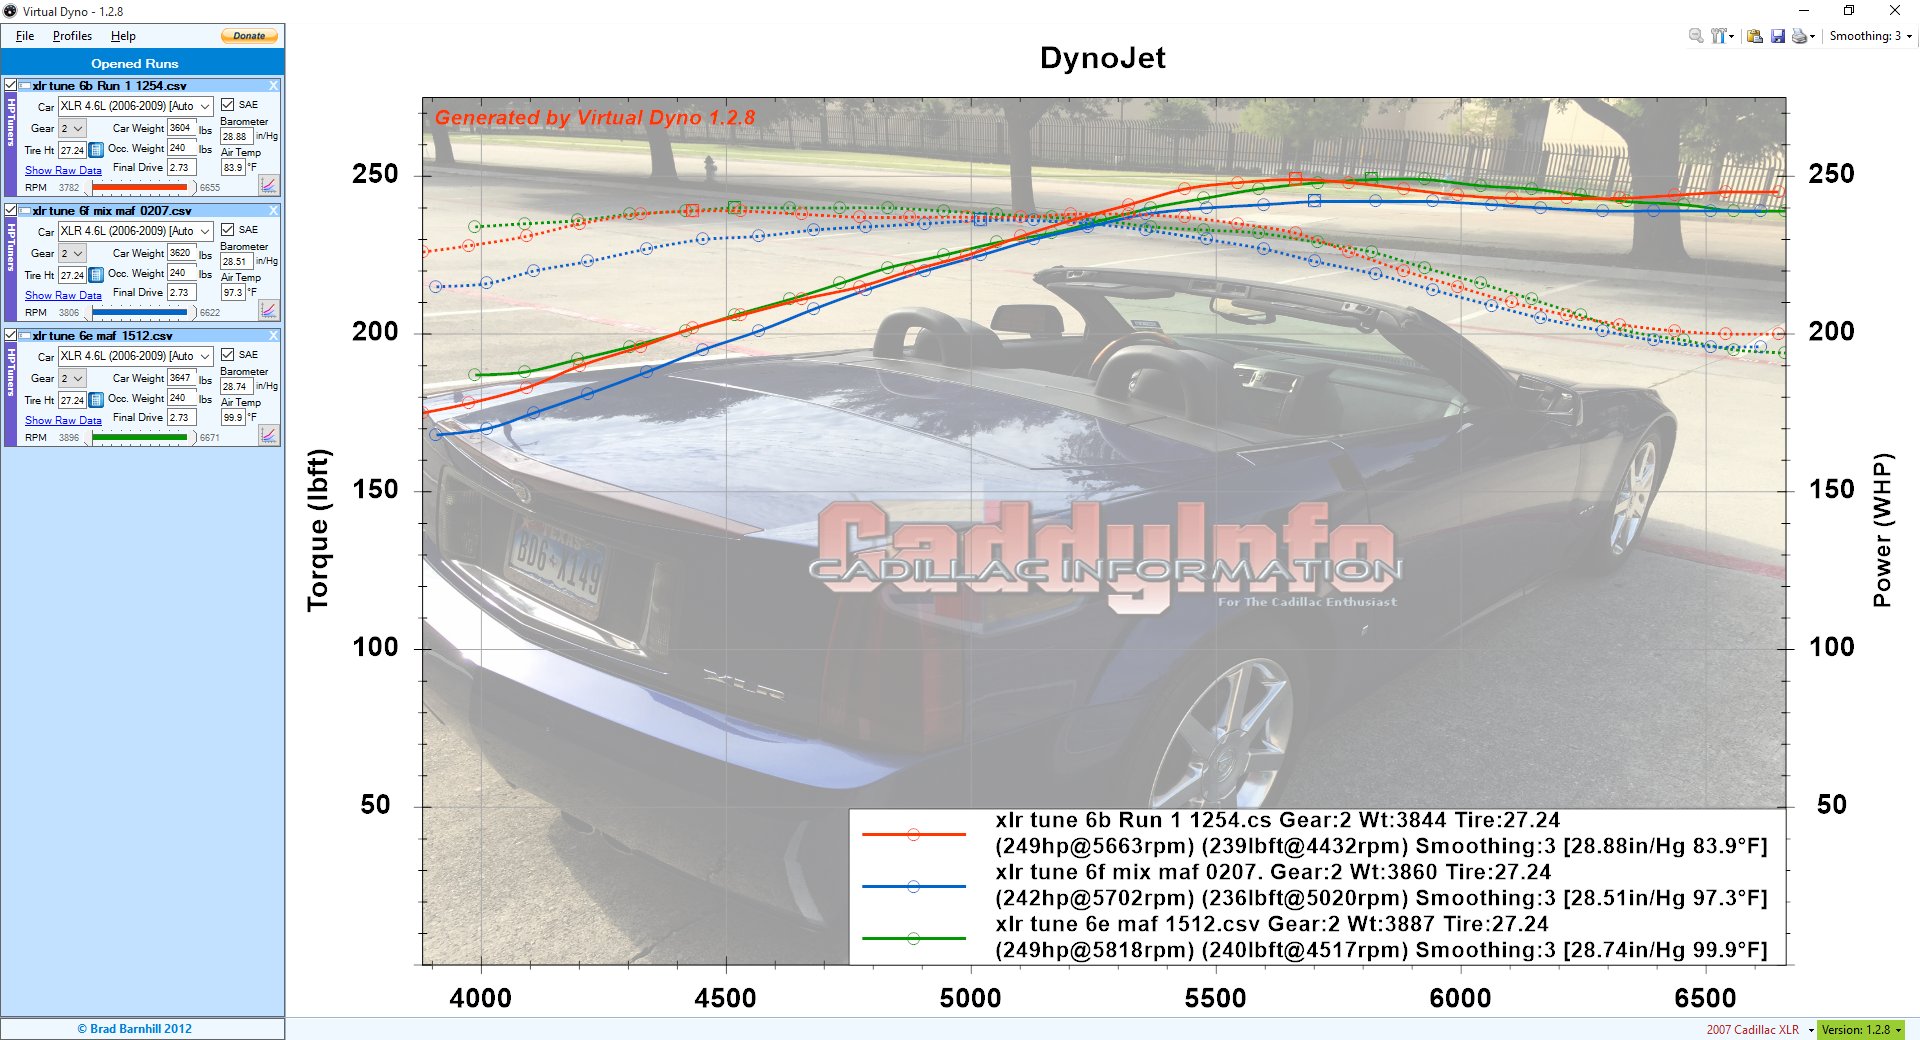
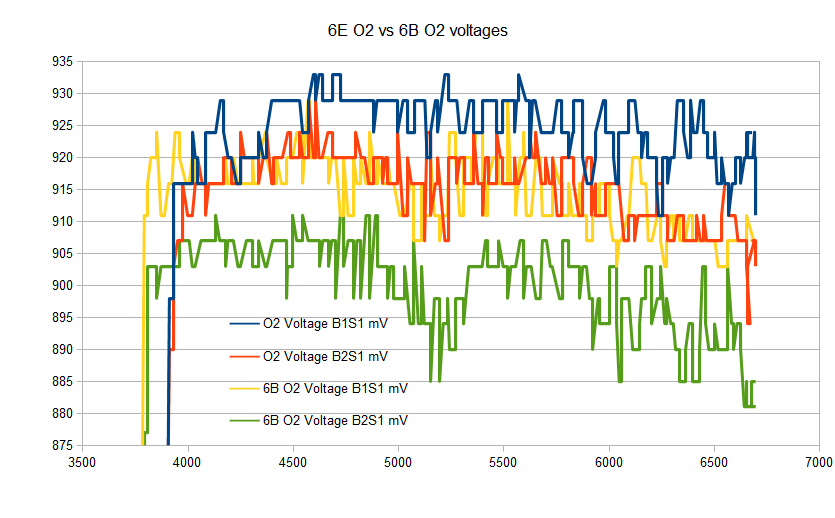
Tonight’s run is in BLUE. The comparison, same-calibration 6F is in RED.  The GREEN Tune 6B is the great first test after VVT Tune with the mid-hump.  Both 6F’s have the same tuning in that region.

XLR Tune 6F Retest Weather

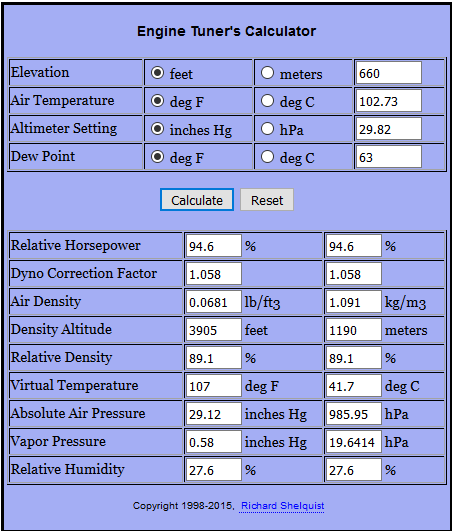
Calculator: https://wahiduddin.net/calc/calc_hp_dp.htm

Weather: http://www.srh.noaa.gov/data/obhistory/KDFW.html

This is the calculator I am using to adjust for altitude, humidity, and temp.  Then I feed the dry-air absolute baro and test temp into Virtual Dyno.  This results in a close match :  the dyno correction is 1.058 above; the Virtual Dyno factor from uncorrected to corrected is also 1.058 with these changes for today’s conditions.

XLR Tune 6F RETEST only 6F Retest and 6F

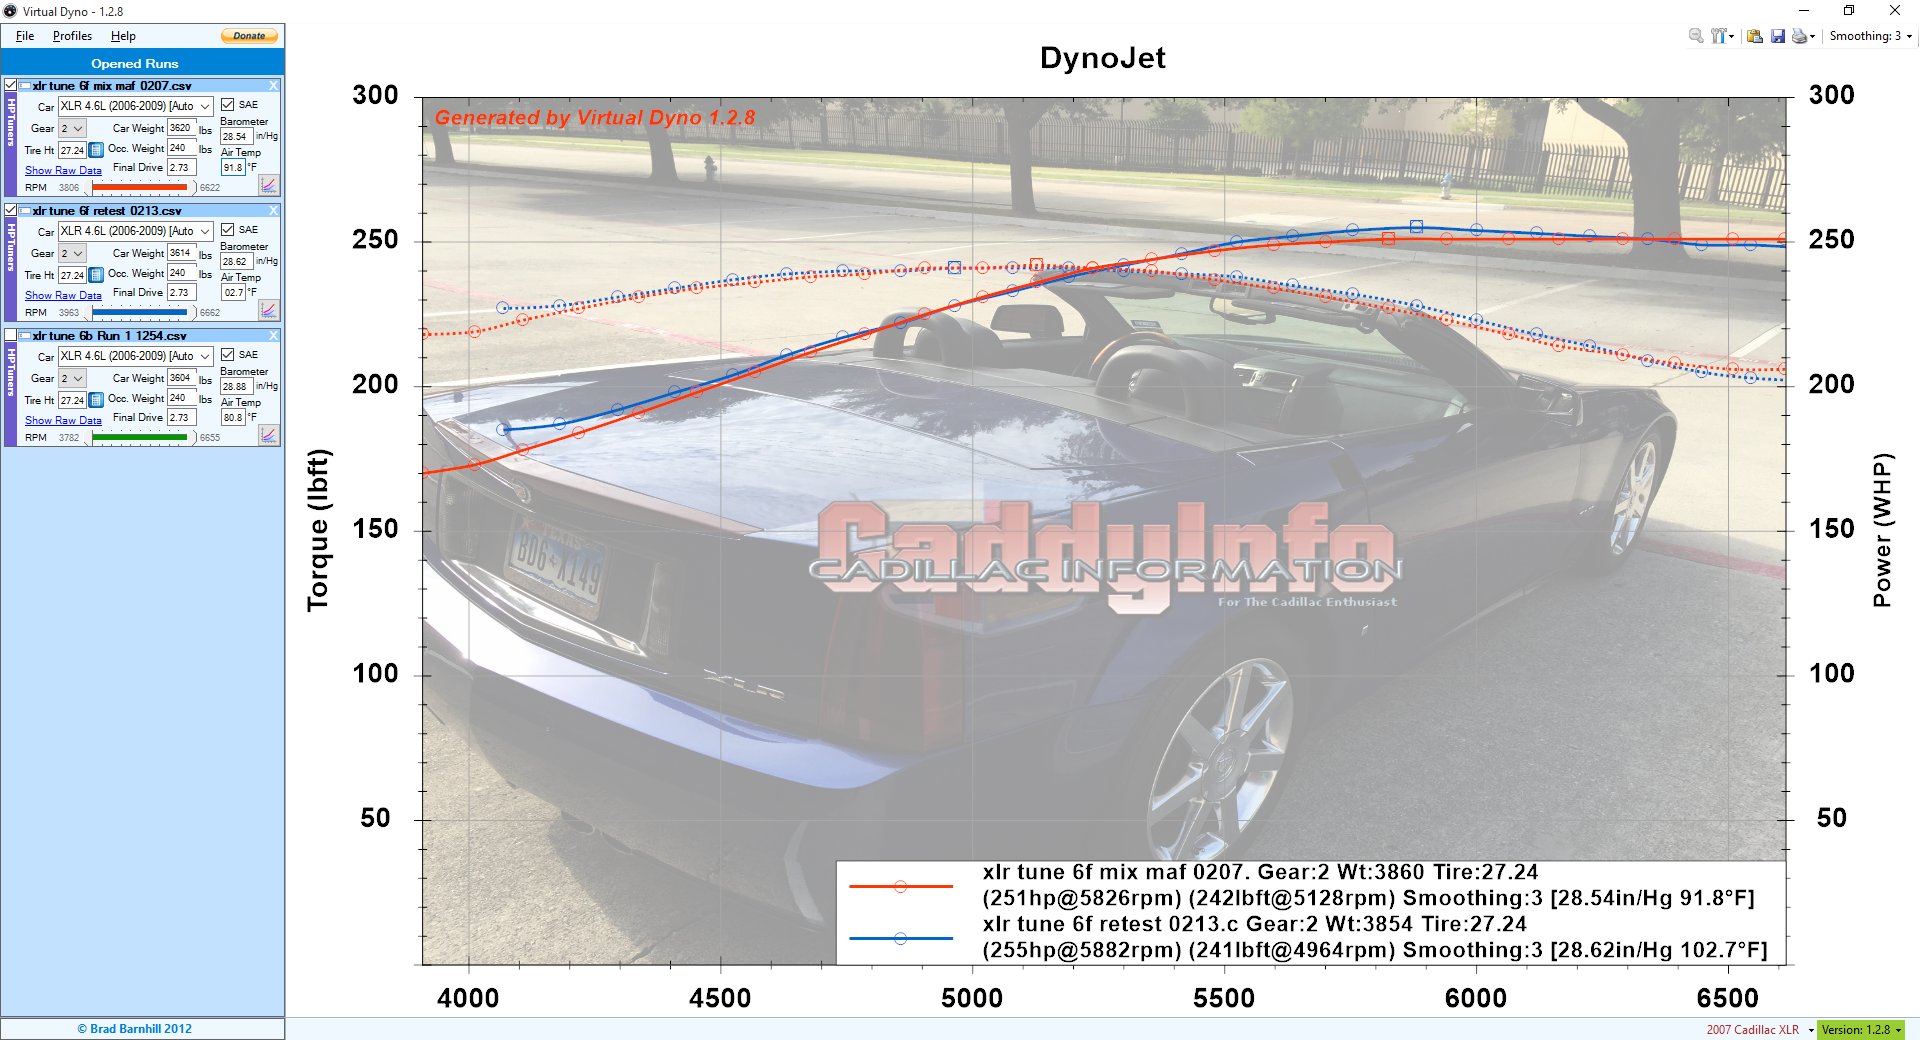
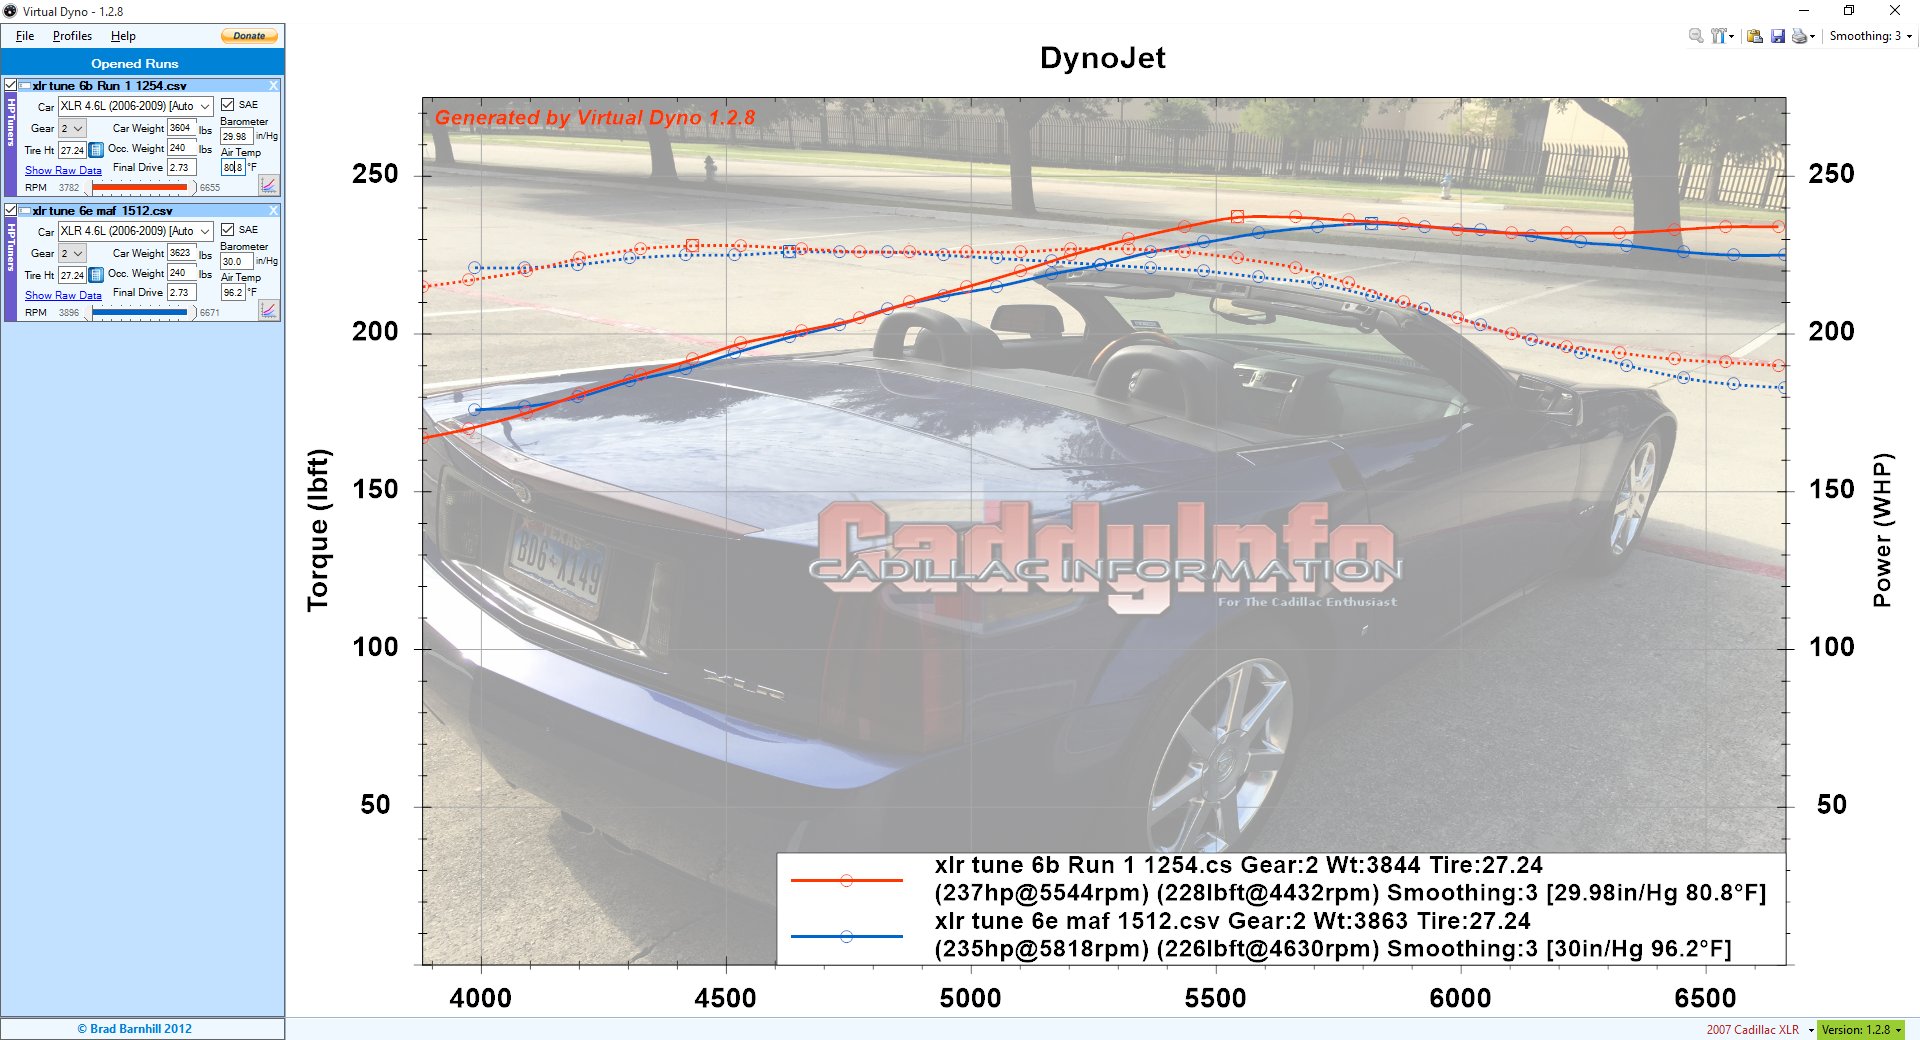
The Tune 6F retest matches well with the Tune 6F test result, which is what we hope to see.  The peak is 4 whp different, but these are identical calibrations on different days.

XLR Tune 6F RETEST hptuners HP Peak

The Calculated hp peak in HP tuners for Tune 6F Retest was 295.7;  corrected that would be 295.7 x 1.058 = 312.9 hp in 2nd gear.  Next will be more runs with this tune to further characterize baseline after the Virtual Dyno profile issue.  What we want to see is when corrected for conditions, repetitive runs of the same tune show very close results.


XLR Tune 6F-R comparison with engine dyno

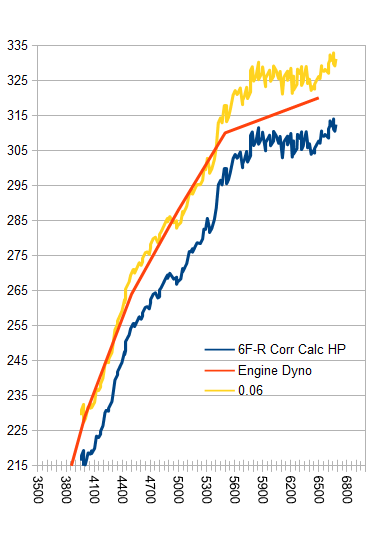
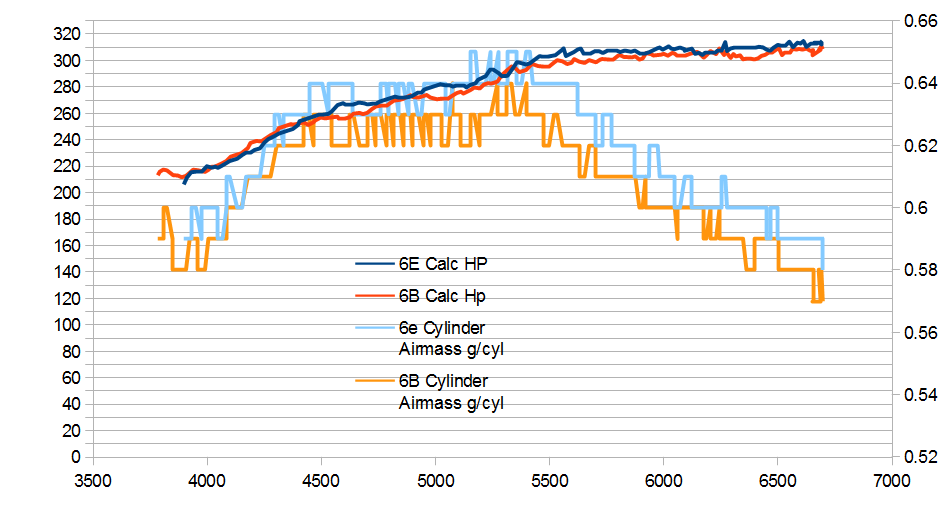
This chart is a comparison of Cadillac’s engine dyno result in red with the corrected calculated hp result from HPTuners in blue.  In my STS-V with a similar transmission the 2nd gear virtual dyno ran 6% less than my chassis dyno.  If that correction is also correct here, it (yellow) overlays the engine dyno plot up to 5400 rpm or so.


Cadillac XLR LH2 Tuning — Tune 6F Mixed MAF recal

Today’s Tune 6F uses the High Baro MAF calibration from 6B except from 4200-5200 rpm, where it pulls the air fuel ratio slightly (2%) richer.  What I hoped to see is a very flat air fuel ratio in the NBO2s, because that’s what we are commanding in the PE (12.5 AFR or 1.176).

The test setup had another freeze ahead of the test.  This time at least the XLR didn’t tilt, and after a few stop, turn the engine off, reassemble all connectors, restart the software, it started scanning again.

My prediction was that we would see the same result as Tune 6B, with better support from 4200-5200 RPM due to no fueling dip there.  Overall the result was not what I expected, but then, I’ve come to expect that.

XLR Tune 6F Mixed Maf

The red line is Tune 6B.  The ONLY difference between Tune 6B and Tune 6F is 4200-5200 rpm.  So the fact that Tune 6F comes to 4000 RPM 13 whp behind is a mystery (different days, different conditions, etc).  From 4200-5200 Tune 6E does well enough, but missing the tuned-in VVT hump at 5500 rpm.  Tune 6B does better from 6000+ rpm (but they are exactly the same out there!)

XLR Tune 6F AFR vs MAF Freq

This graph shows the narrow band trend for AFR for Tune 6F in blue, 6B in red.  I think the blue is much flatter, which was the goal for the test.  I included the MAF frequencies in yellow so I could easily relate the various regions to the way the MAF calibration works in the tuning tables.  Something odd happens to the air flow at 5200 rpm or so on both.

Again, the AFR is commanded flat from 4000-6800 RPM so I am calibrating the MAF to drive the blue line flat across the graph (ignoring the noise in the line).

XLR Tune 6F hptuners

Hptuners result showing max calculated HP for conditions for 6F.

XLR Tune 6B max HP b

Similar data for Tune 6B at max hp for that run.

In summary, good that the MAF calibration changes drove a more consistent AFR.  Again, not sure why I am seeing large day to day changes, except of course different days, different conditions, etc.  Perhaps every test needs to be Run Tune A, stop, recalibrate, Run Tune B, then compare.  That way they are on the same day, more or less similar conditions, etc.   Virtual Dyno does try to correct for baro and temp, but still seeing some variances creep into the tests.

UPDATE

After consideration, I believe part of the variability I am seeing is that Virtual Dyno corrects for baro and temp but not for humidity/dewpoint.   46% humidity (like today here) can double the dyno correction factor vs dry air.

xlr tune 6F comparison humidity corrected

I plan to return to a process of using a calculator to correct for altitude, dewpoint, and humidity to arrive at absolute pressure and temperature for dry air, then put those values into Virtual Dyno for each run.  That will eliminate another source of variation.

UPDATE 2:

After some comparisons I see that if I put in adjusted pressure in dry air and test temp (as opposed to dry air temp) then I get almost the same multiplier as suggested by the dyno adjustment, within 0.1%

XLR Tune 6F comparison corrected

So this is my new plan on how to input baro and temp for Virtual Dyno.  This still leaves Tune 6F below the prior runs, but I will get more samples and see if this one was an outlier or we learn more.


Cadillac XLR LH2 Tuning VVT Tune 6E – MAF adj, Baseline

For Tune 6E I returned to Tune 6B, except I further corrected the MAF signal in high frequency to a smoother curve.

xlr Tune 6E Maf adj compare 6B

Click to zoom in, back to return.

Today’s run in blue, comparison best run 6B in red.  These have the same setting except for the MAF tuning.  The blue is lower than the red in mid and high rpm.

Today’s run was a big hit with the airflow, and with the calculated hp, in hotter weather, with more weight in the XLR (gas).

xlr tune 6e comparison with 6b

I am not sure why that doesn’t translate into a better measured performance, which is what I expected to see.

I am taking 6E as the current baseline (tuning is identical to 6B) and will run more baseline tests to check.

XLR 6E vs 6B O2 voltages -- 6B is 10 mv lower

Narrow band O2 meters are notoriously poor at reading exact AFR, but the 6B was running 10-15 mv lower on each side than the 6E.  This suggests the XLR is running richer in 6E than in 6B.  This could be the effect of different days, or it could be that with the MAF adjustments in 6E vs 6B the PCM recognized the higher airflow now and is adding more fuel to get to 12.5:1.  So although closer to commanded now, perhaps the XLR would prefer 12.8:1 again?