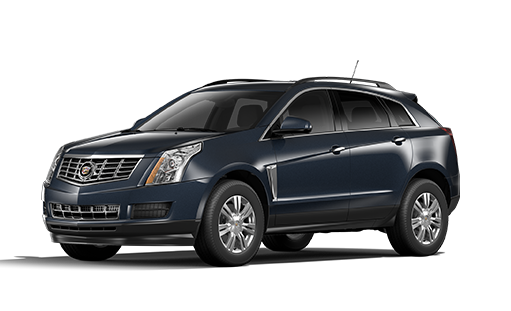
Cadillac Reports April Global Sales of First CT6s and XT5s


Cadillac sold 19,983 new vehicles globally in April, a decrease of 18%, as the brand phases out its top-selling SRX Crossover in advance of shipments of the all-new XT5 successor.

With the XT5 Cadillac is launching the new crossover into the strongest segment in the luxury marketplace. Deliveries of SRX fell sharply in April as inventory levels dropped in advance of more widespread availability of the all-new XT5.

Initial low-volume shipments of the all-new CT6 flagship sedan occurred in April, eagerly snapped up by customers. Dealer deliveries will accelerate during May.

In the U.S. market, Cadillac average transaction prices were $54,251 according to J.D. Power Information Network, through April 17. This is highest among full-line luxury brands.

“Earning transaction prices in the market above the European competitors reinforces both the rising stature of Cadillac in consumers’ minds, and our disciplined approach to target the pinnacle of premium,” said Cadillac President Johan de Nysschen. “Our crossover entry is in transition from the SRX to the XT5, creating a temporary inventory challenge. As that transition occurs, it is positive to see consumers placing a higher value on Cadillac’s product substance.”

The first-ever CT6, assembled in both Detroit and Shanghai, establishes a new top of Cadillac’s sedan range.  The new XT5 began initial deliveries in the US in April, with global sales starting later this spring.

Cadillac sales in key regions appear in the table below.

GLOBAL SALES BY PRODUCT LINE
  Apr-16 Apr-15 % Change YTD-16 YTD-15 % Change
ATS 4,315 4,956 (12.9) 16,326 17,853 (8.6)
CTS 1,588 2,012 (21.1) 6,400 7,309 (12.4)
ELR 95 105 (9.5) 362 431 (16)
XTS 3,830 4,175 (8.3) 17,547 17,384 0.9
CT6 561 0 956 0           –
SRX 5,630 9,236 (39) 25,837 29,294 (11.8)
XT5 381 0 396 0
Escalade 3,583 3,885 (7.8) 13,322 13,064 2
Other 0 0  – 0 1
Total 19,983 24,369 (18) 81,146 85,336 (4.9)
GLOBAL SALES BY COUNTRY
  Apr-16 Apr-15  % Change YTD-16 YTD-15 % Change
United States 11,236 15,801 (28.9) 46,869 52,976 (11.5)
China* 7,007 6,197 13.1 27,698 25,705 7.8
Canada 980 1,496 (34.5) 3,423 3,464 (1.2)
Middle East 305 472 (35.4) 1,241 1,722 (27.9)
Mexico 114 155 (26.5) 611 571 7
EU** & Russia 191 132 44.7 700 361 99.4
ROW 150 116 29.3 614 537 14.3
Total 19,983 24,369 (18) 81,146 85,336 (4.9)


April includes #Cadillac CT6 and XT5 sales

April sales included the first CT6 and XT5 sales, with the XT5 edging out the CT6.

Overall, Cadillac sales were down in April as Cadillac Dealers cleared the final SRXs  and the new XT5s arrived on vehicle carriers in late April / early May.  With those missing SRX sales Cadillac would have been much closer on the month.  SRX still led all vehicles in sales.

2016-srx-jellybean-511x311

2016 Cadillac SRX

Good bye to the SRX – Hello to the XT5

2017-xt5-jellybean-511x311

2017 Cadillac XT5

US sedan sales (including coupes) were down across the board for Cadillac.  The ATS led with 1,737 (down 18%) followed by XTS with 1,521 (down 32%) and CTS with 1,335 (down 23%).  265 CT6s got to Dealers in time to find lucky new owners in April, and the ELR kept near the 100/mo pace at 95.

Even Escalade sales were down 7%.

  April (Calendar Year-to-Date)
January – April
  2016 2015 %Change Volume   2016 2015 %Change Volume  
ATS 1,737 2,119 -18.0   6,254 7,943 -21.3  
CT6 285 0 ***.*   320 0 ***.*  
CTS 1,335 1,726 -22.7   5,308 6,362 -16.6  
ELR 95 104 -8.7   357 415 -14.0  
Escalade 1,808 1,945 -7.0   6,829 6,771 0.9  
Escalade ESV 1,199 1,292 -7.2   4,285 4,365 -1.8  
SRX 2,952 6,390 -53.8   15,818 18,684 -15.3  
XT5 304 0 ***.*   304 0 ***.*  
XTS 1,521 2,225 -31.6   7,394 8,434 -12.3  
Cadillac Total* 11,236 15,801 -28.9   46,869 52,976 -11.5

 Cadillac Notes from the Press Release:

  • Cadillac ATPs were $54,600 in April, up approximately $1,600 from last year.
  • The Cadillac ATS, CTS and XTS all gained year-over-year retail market share in their respective segments.

By comparison, for the month BMW sales were down 7%, with Mini down 14%. 3-Series were off 32% and 7-Series were off 42% year over year. Mercedes overall sales were almost even (-0.4%) but CLA sales were down 21% and S-Class sales were down 34%.

Cadillac continues to drive up average transaction prices, to $54,600 in April.   Hopefully the XT5 and CT6 launches will go well and we’ll see more Cadillacs getting to happy owners in May.

Vehicle Sales BMW of North America, LLC, April 2016

Apr.2016

Apr.2015

%

YTD Apr.2016

YTD Apr.2015

%

i3

814

406

100.0%

1,576

3,087

-48.9%

i8

130

138

-5.8%

305

479

-36.3%

2 Series

1,780

1,009

76.4%

5,181

3,156

64.2%

3 Series

4,681

6,866

-31.8%

18,781

27,086

-30.7%

4 Series

3,226

3,508

-8.0%

12,451

14,219

-12.4%

5 Series

4,454

4,294

3.7%

14,164

16,359

-13.4%

6 Series

278

313

-11.2%

1,117

4,495

-75.2%

7 Series

872

1,507

-42.1%

3,185

3,448

-7.6%

Z4 

104

87

19.5%

321

889

-63.9%

X1

1,447

886

63.3%

7,947

3,647

117.9%

BMW passenger cars

17,786

19,014

-6.5%

65,028

76,865

-15.4%

X3

2,422

2,401

0.9%

12,633

8,407

50.3%

X4

364

920

-60.4%

1,837

2,381

-22.8%

X5

3,771

4,095

-7.9%

13,814

15,846

-12.8%

X6

608

522

16.5%

2,252

1,945

15.8%

BMW light trucks 

7,165

7,938

-9.7%

30,536

28,579

6.8%

BMW brand

24,951

26,952

-7.4%

95,564

105,444

-9.4%

Cooper /S Hardtop 2 Door

1,136

2,141

-46.9%

4,422

7,071

-37.5%

Cooper /S Hardtop 4 Door

976

1,503

-35.1%

4,428

4,797

-7.7%

Cooper /S Convertible

541

301

79.7%

549

996

-44.9%

Cooper /S Clubman

884

3

29366.7%

2,579

8

32137.5%

Coupe

0

58

-100.0%

0

159

-100.0%

Roadster

1

144

-99.3%

3

414

-99.3%

Countryman

1,249

1,244

0.4%

3,615

4,469

-19.1%

Paceman

9

82

-89.0%

39

339

-88.5%

MINI brand

4,796

5,476

-12.4%

15,635

18,253

-14.3%

TOTAL BMW of North America, LLC

29,747

32,428

-8.3%

111,199

123,697

-10.1%

Mercedes April Sales:

MERCEDES-BENZ USA
Sales — April 2016

Mercedes-Benz
Passenger Vehicles

Apr-16

Apr-15

Monthly %

YTD 2016

YTD 2015

Yearly %

B-CLASS

56

158

-64.6%

217

652

-66.7%

CLA

2,121

2,670

-20.6%

9,005

10,896

-17.4%

C-CLASS

5,645

6,665

-15.3%

23,484

27,608

-14.9%

E-CLASS/CLS

4,882

4,004

21.9%

14,467

16,534

-12.5%

S-CLASS

1,329

2,021

-34.2%

5,496

7,117

-22.8%

SLK

465

431

7.9%

1,315

1,248

5.4%

SL

312

434

-28.1%

1,199

1,478

-18.9%

AMG GT

140

205

500

205

*SLS AMG

4

1

20

GLA

2,137

2,081

2.7%

8,980

7,750

15.9%

GLC/GLK

4,439

3,071

44.5%

15,437

8,728

76.9%

GLE/M-CLASS

4,327

4,945

-12.5%

16,668

15,428

8.0%

GL/GLS

2,991

2,195

36.3%

6,871

8,530

-19.4%

G-CLASS 

392

300

30.7%

1,365

1,146

19.1%

TOTAL

29,236

29,184

0.2%

105,005

107,340

-2.2%

Vans1

2,589

2,764

-6.3%

9,829

8,323

18.1%

smart

466

480

-2.9%

1,766

2,013

-12.3%

    MBUSA
Combined Total

Apr-16

Apr-15

Monthly %

YTD 2016

YTD 2015

Yearly %

GRAND TOTAL

32,291

32,428

-0.4%

116,600

117,676

-0.9%


1Mercedes-Benz, Freightliner Sprinter and Metris Vans are sold and marketed in the U.S. by Mercedes-Benz USA and Daimler Vans USA, respectively.

*out of production