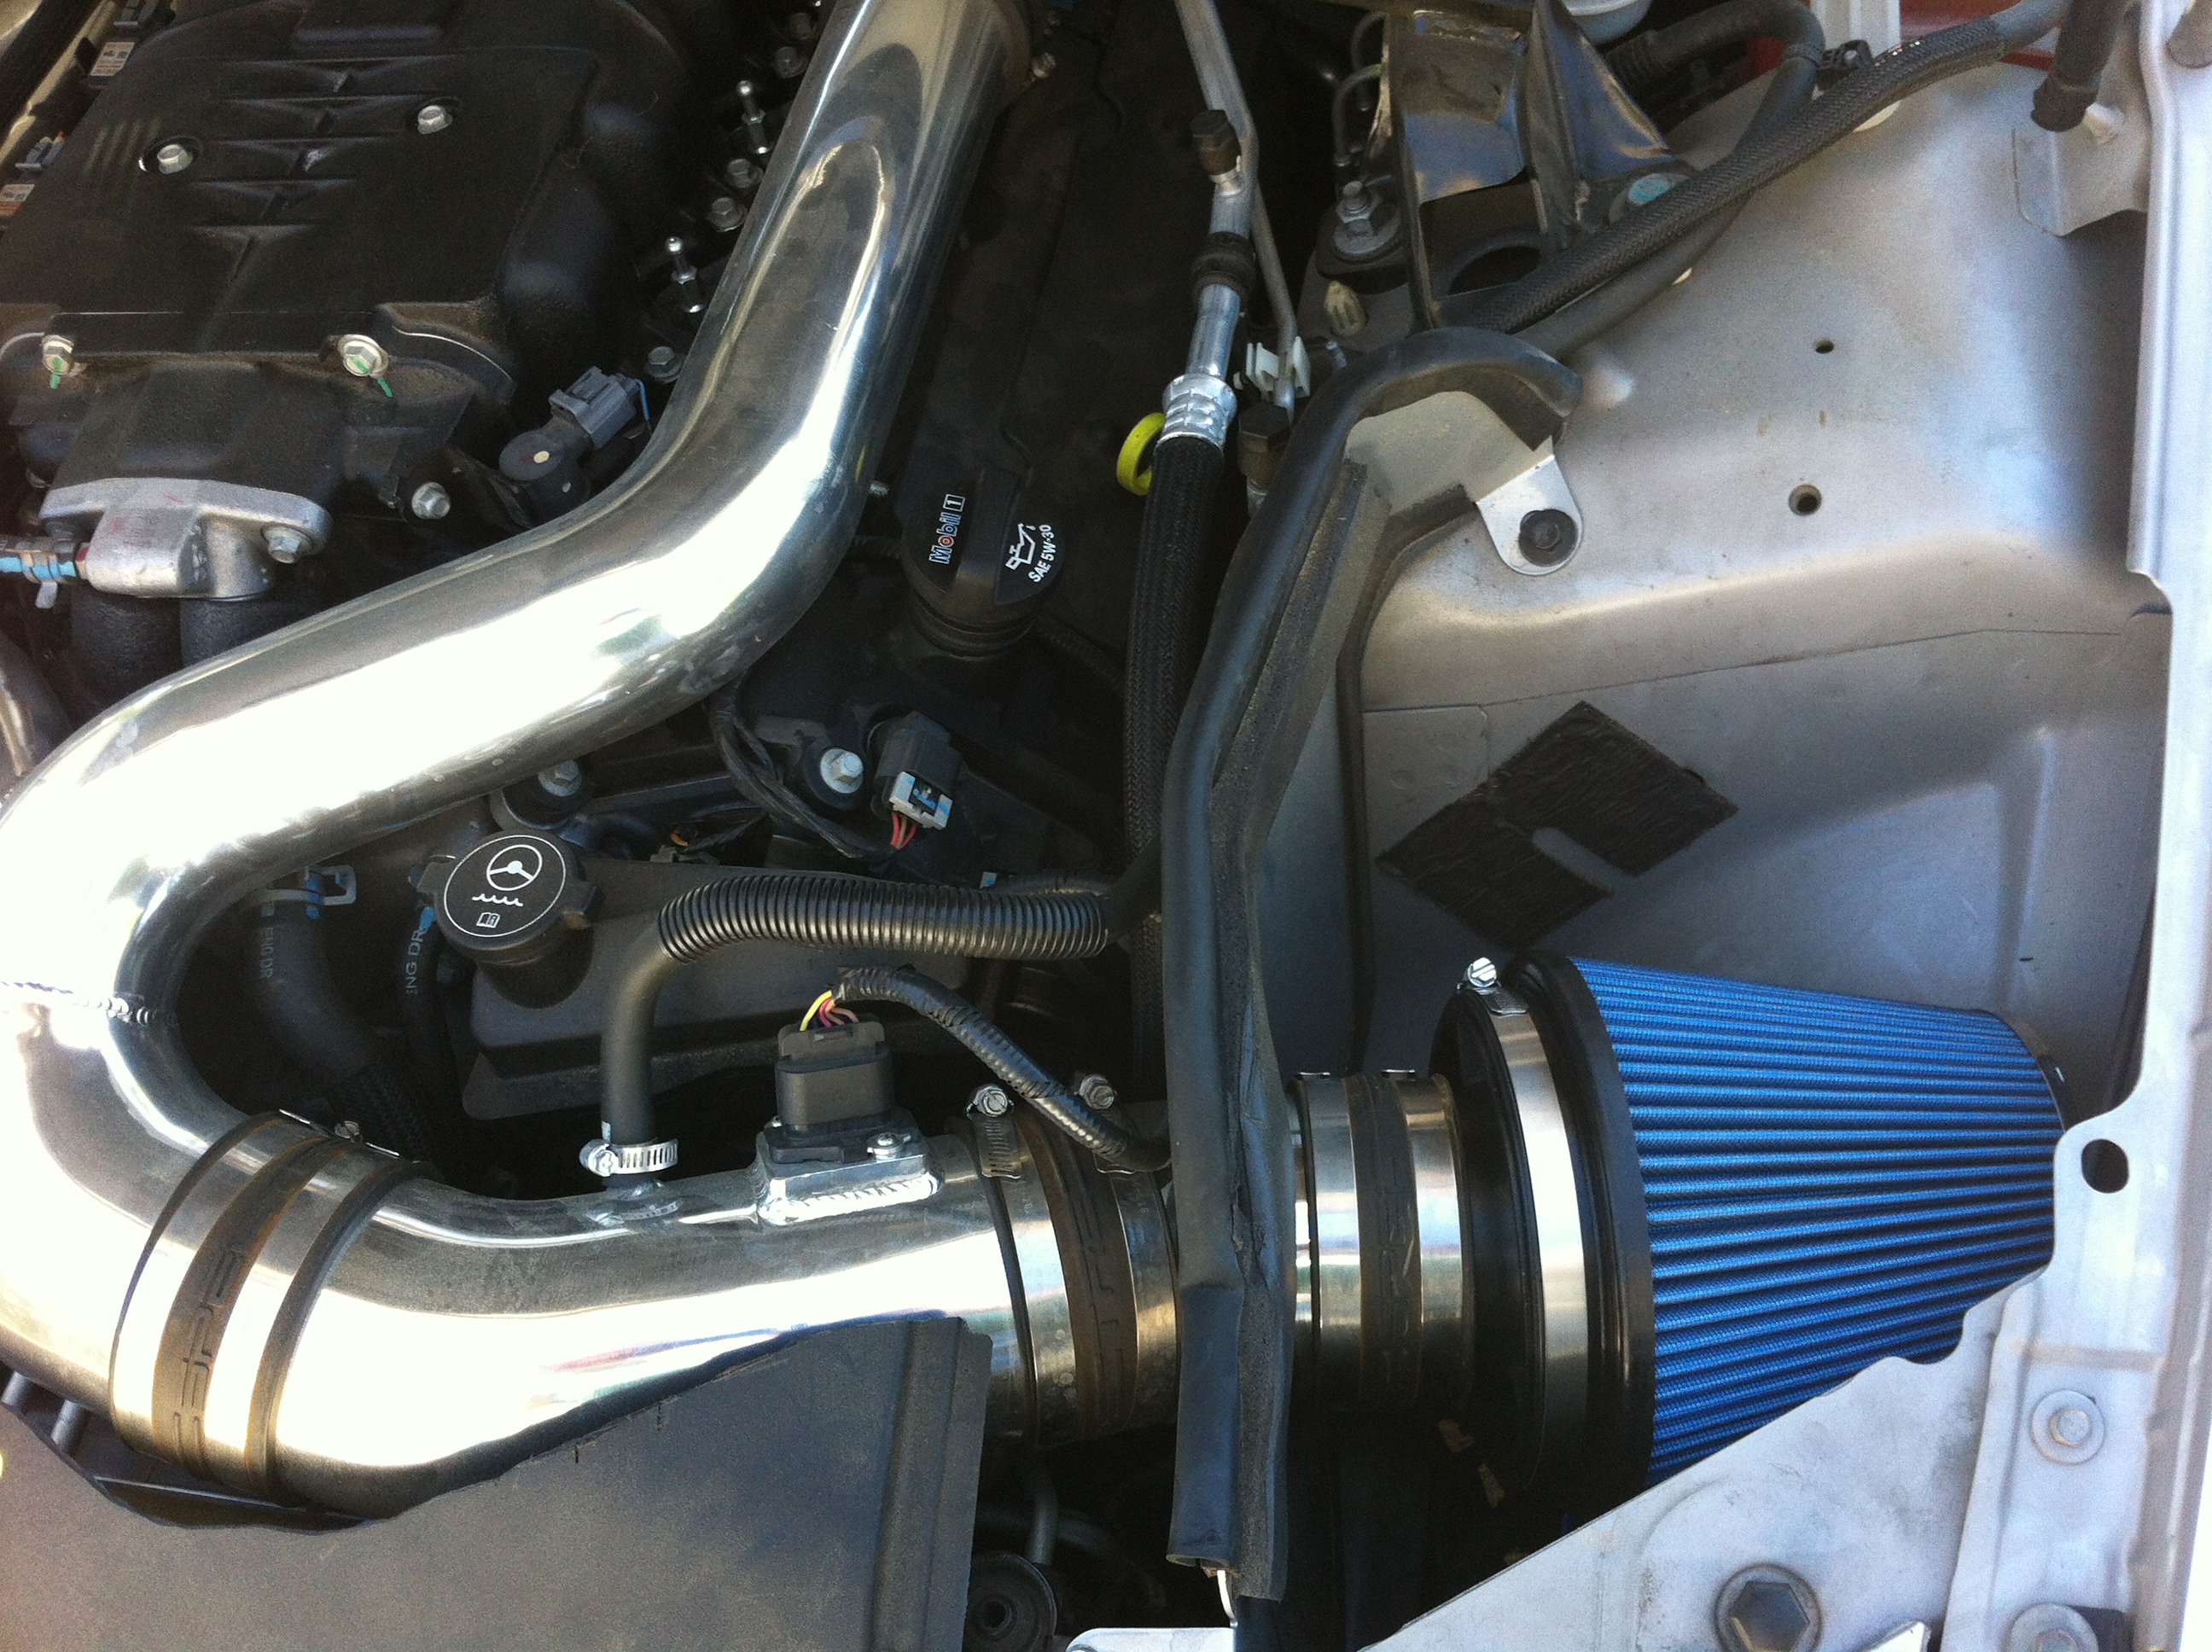
Amsoil 6065 filter installed on the Cadillac STS-V Spectre intake
I recently replaced the Spectre filter in my 2008 Cadillac STS-V (supercharged 4.4L V8) with Spectre CAI with a K&N RU-3100 due to delayed availability of the Spectre replacement. I also picked up an Amsoil eaau6065 filter. These are both the same form factor — 6″ mouth, 6″ long, 7.5″ to 5″ cone shaped. The K&N is oiled gauze, and the Amsoil is a microfiber dry filter.
The K&N was $39.86 ($43 delivered via Amazon) and the Amsoil $60.05 (just over $72 delivered).
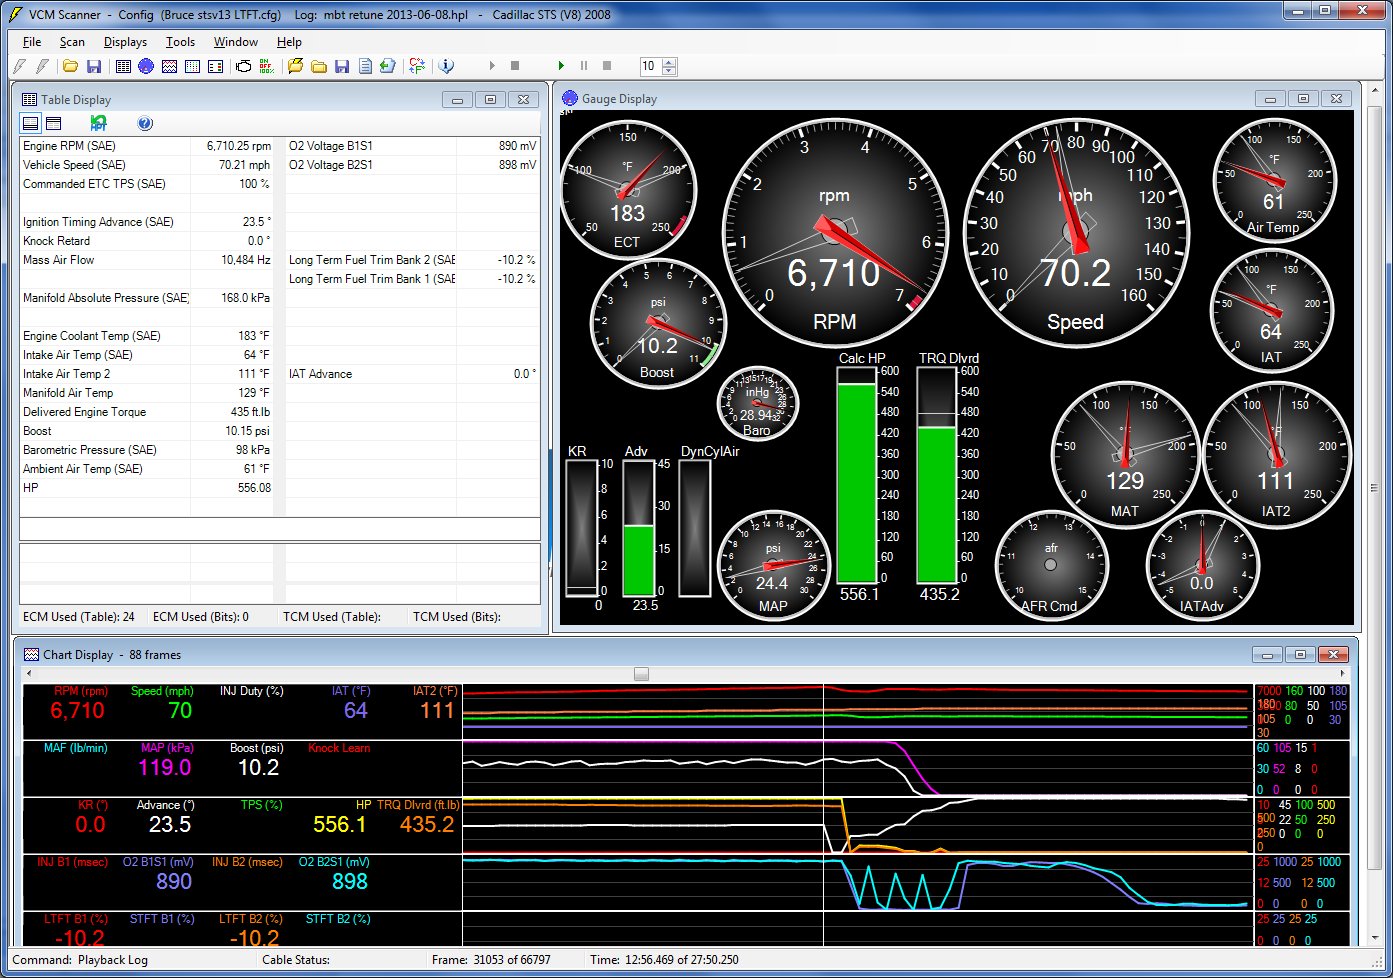
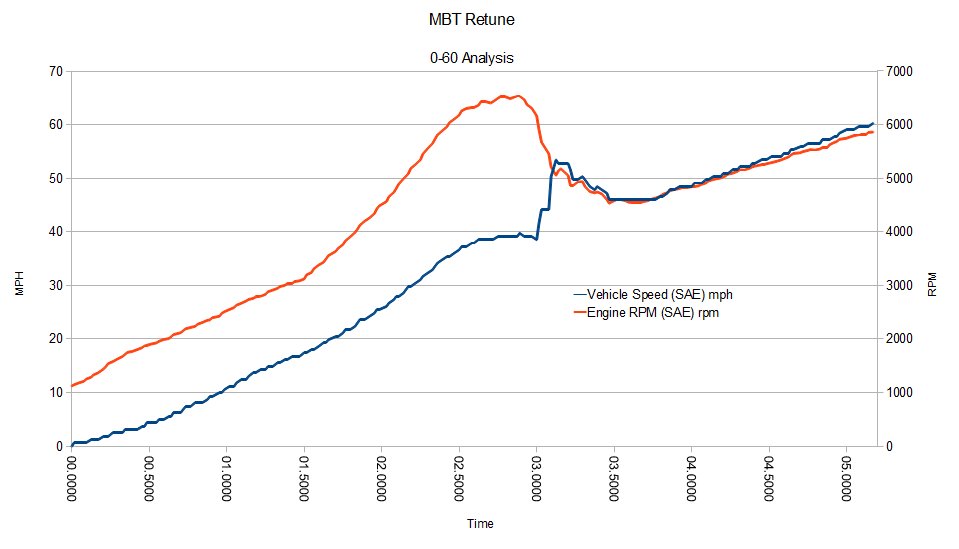
The test runs were done using a similar method but on different days; 88F for the K&N, 91F for the Amsoil test. To test the two filters I used HPTuners to capture both lb/min output from the MAF during a wide open throttle acceleration run in 2nd gear, and vacuum pressure at the supercharger inlet in PSI.
This was a heat-soaked test comparison, meaning that the engine of the STS-V, intercooler, and air inlet were hot, and the day was hot. This results in lower performance, but was similar across the two tests.
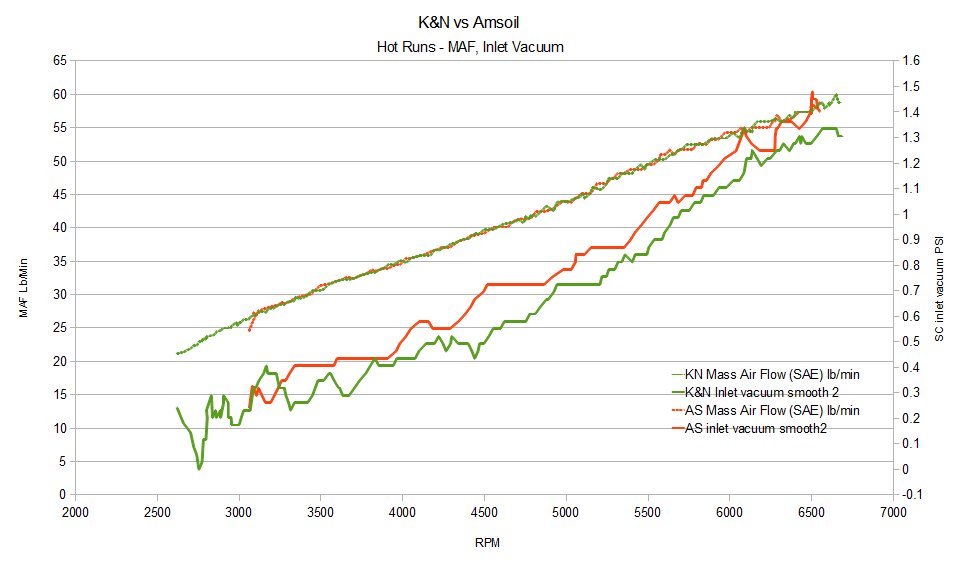
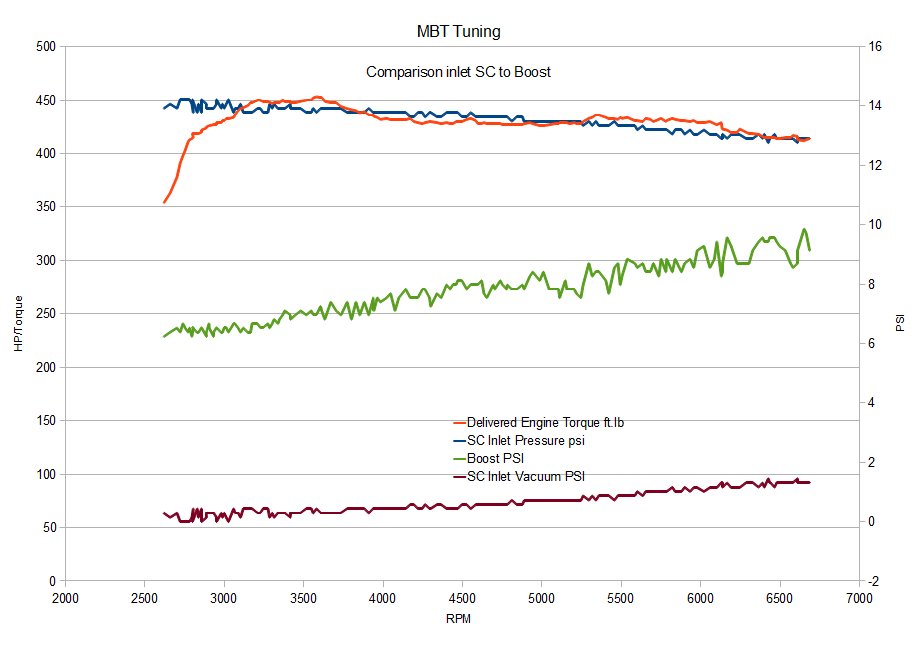
MAF and SC Inlet Vacuum
A higher MAF reading is better, and a lower SC inlet pressure reading is better.
What the test showed is that the 2 filters recorded equivalent MAF readings, but the SC inlet vacuum for the K&N was lower than the Amsoil air filter by 0.0-0.15 psi, or 0-4 inches of water.

Comparison of hot runs K&N and Amsoil
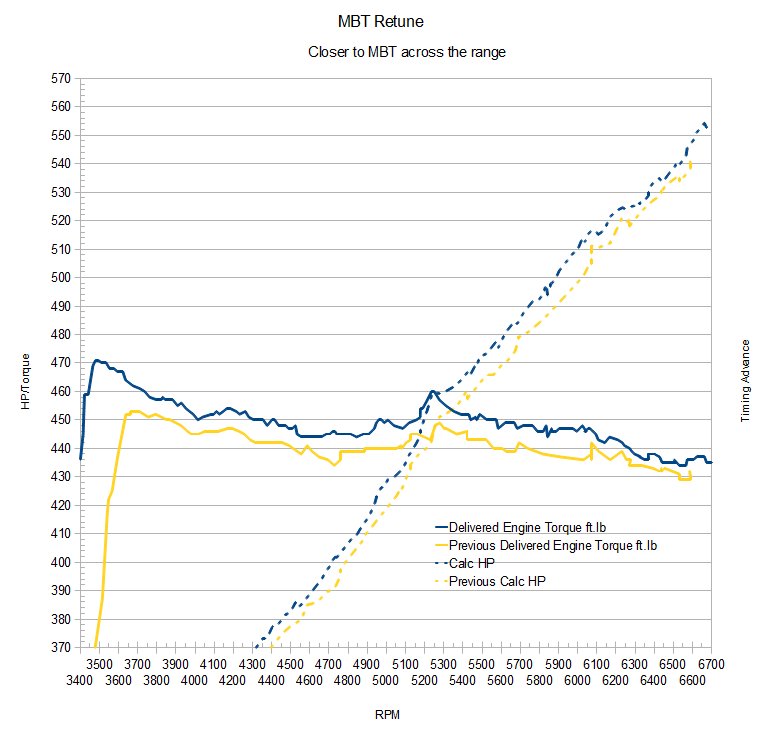
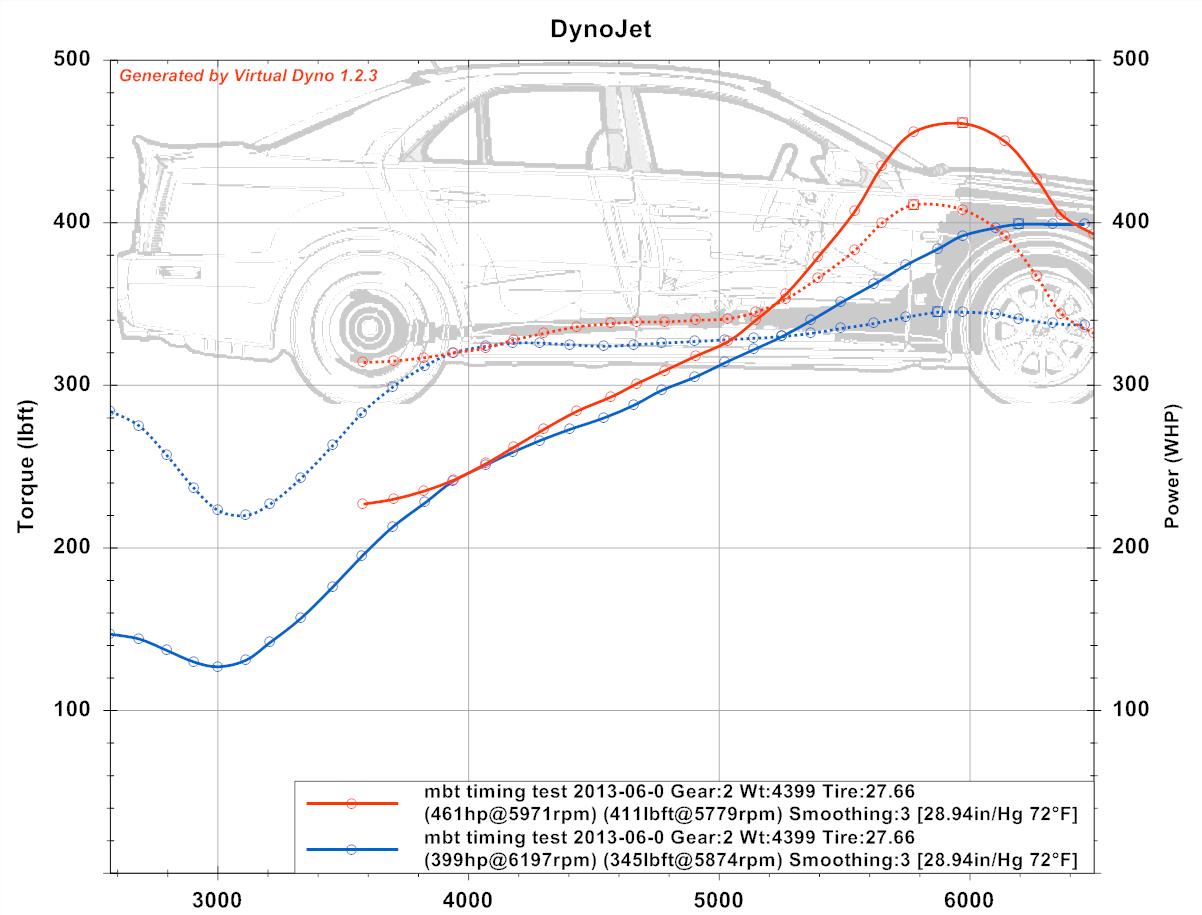
I also ran a virtual dyno which appeared to show equivalent performance with test to test variances. The Amsoil result had equivalent peak hp (366 hp vs 367 hp) and appeared to make more torque at lower RPM, but my impression is this is virtual dyno variance because we don’t see a variance in the MAF readings at similar points.
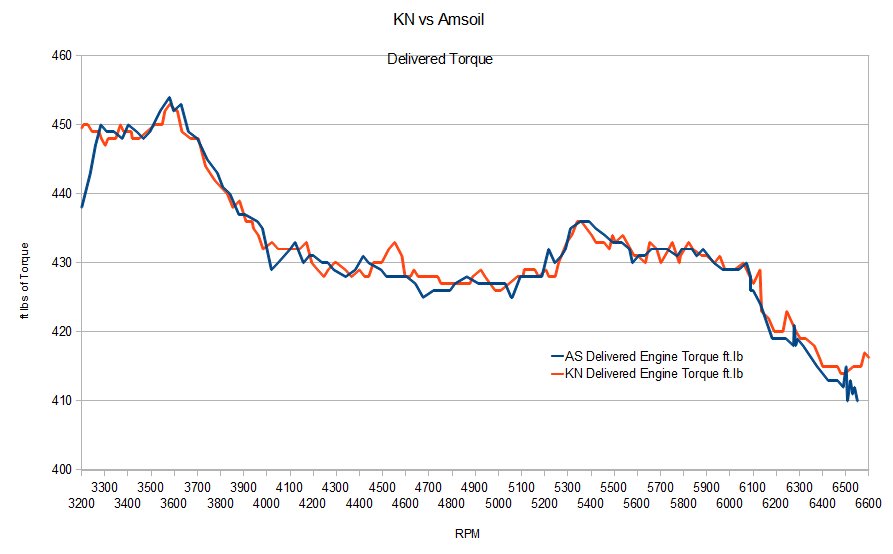
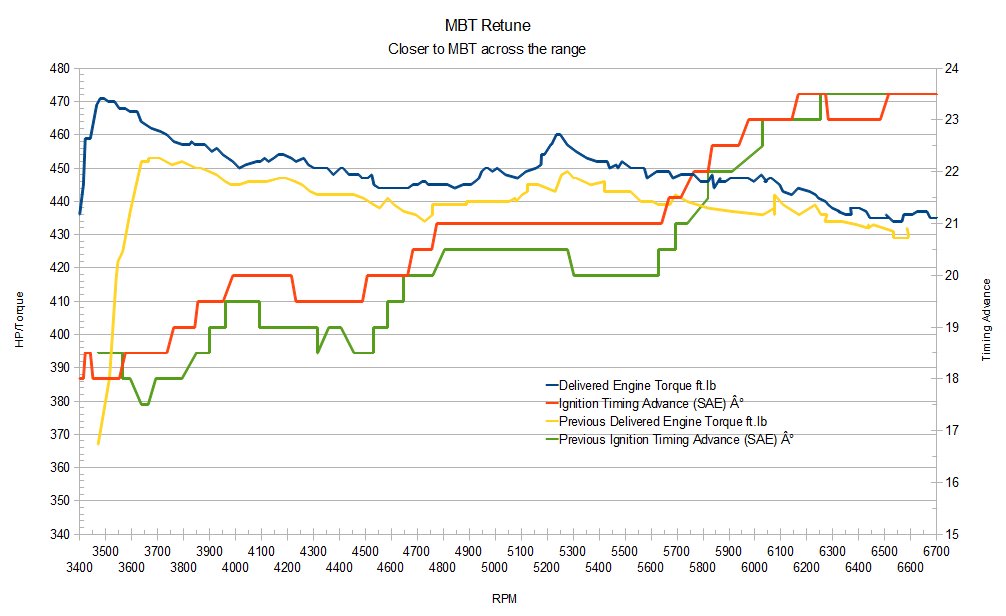
Hp Tuners Delivered Torque Comparison
The PCM’s evaluation of delivered torque from each run appears to be very equivalent. Not surprising as this depends on MAF input, but persuasive that output performance between the two is similar.
Conclusion
The K&N appears to flow slightly better — less vacuum is pulled — but the resulting air flow through the MAF in lb/min and Delivered Torque calculations look very equivalent between the two.