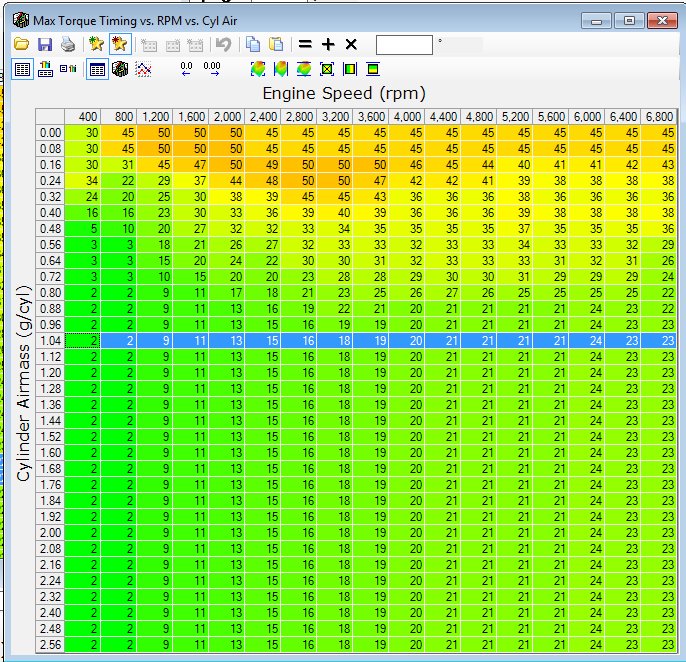
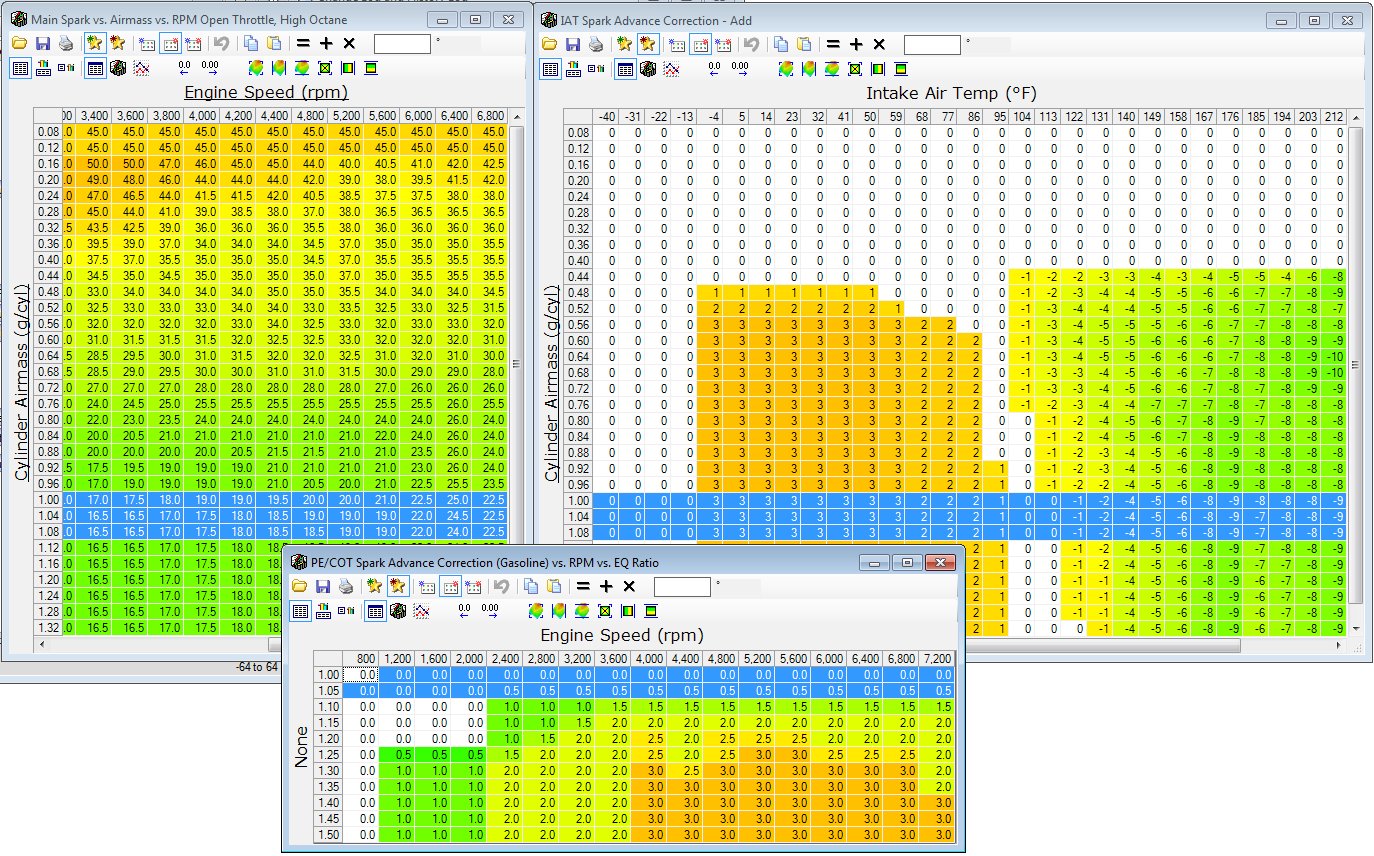
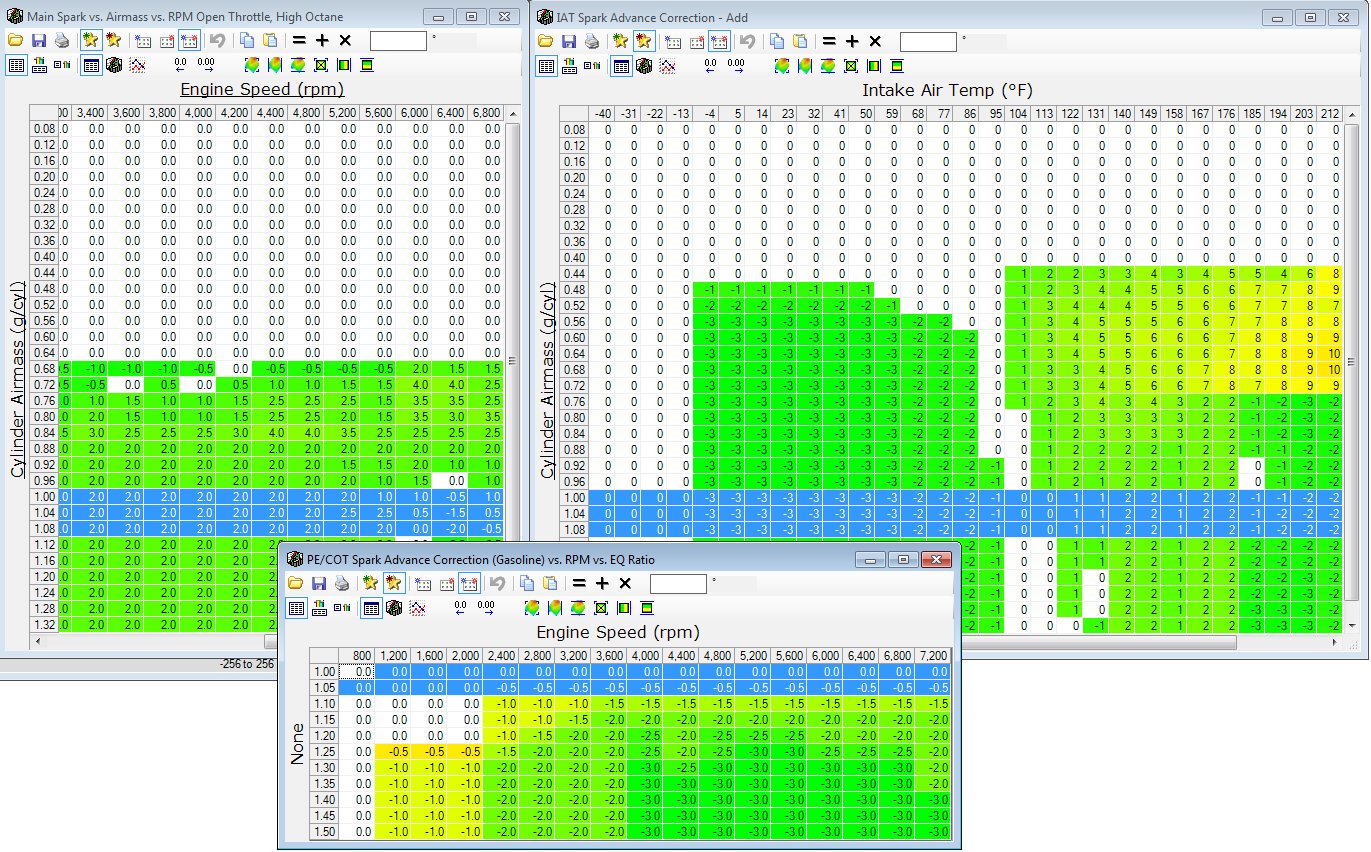
Today I continued my testing toward MBT by adding timing across the rev range to move the commanded advance closer to the MBT vs RPM vs Cyl Air table. 1 degree of advance was added from 3000-3600 RPM, and 0.5 degrees from 3800-6000 RPM.
The V was cold, in cool air, almost out of fuel.
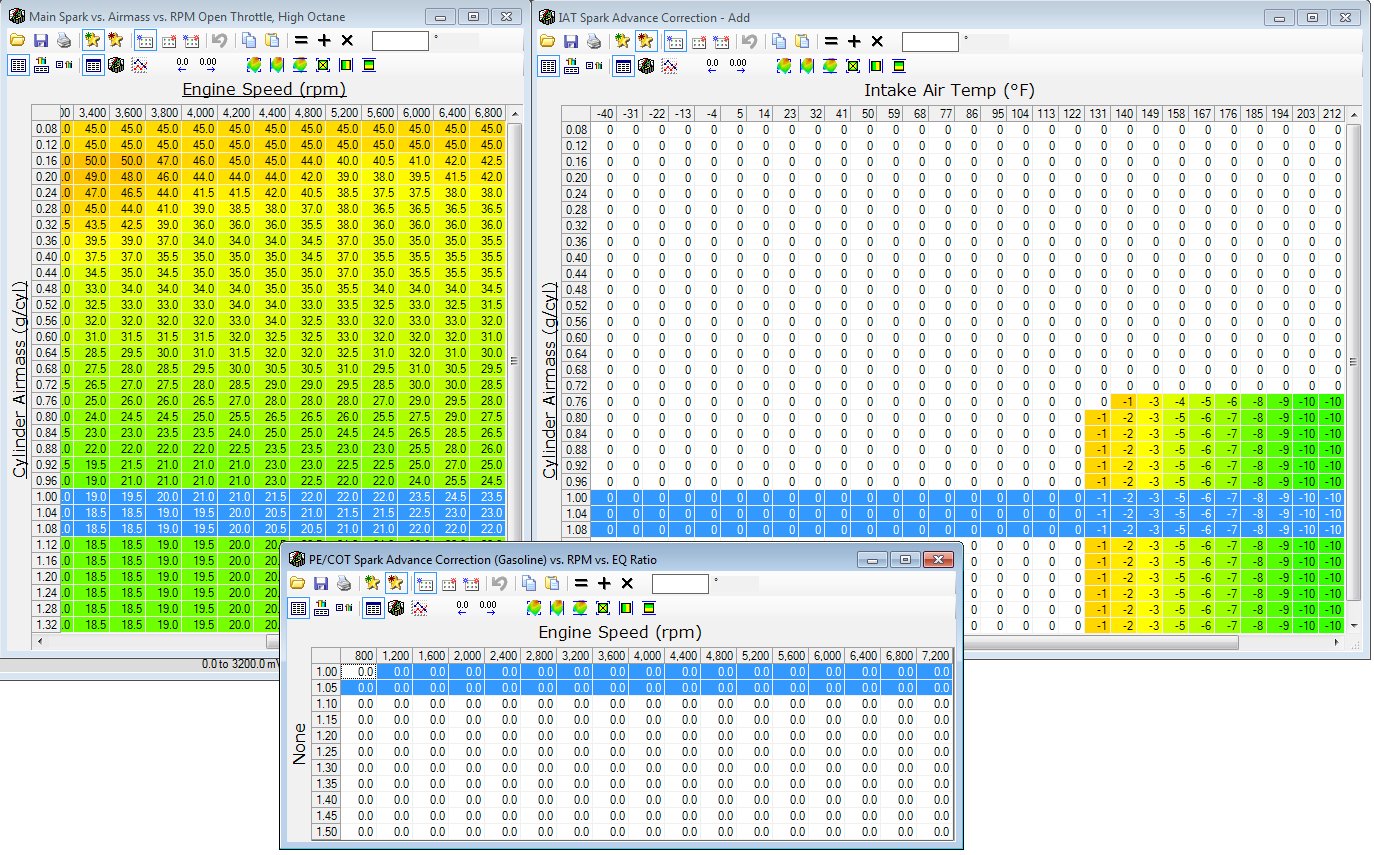
I went to a less densely populated HPTuners table to gauge if that improved the data capture. My impression is this was useful, but that we are capturing info as fast or faster than the related PID are updating anyway. I would prefer to have the more diverse info points than oversample a smaller set for future tests.
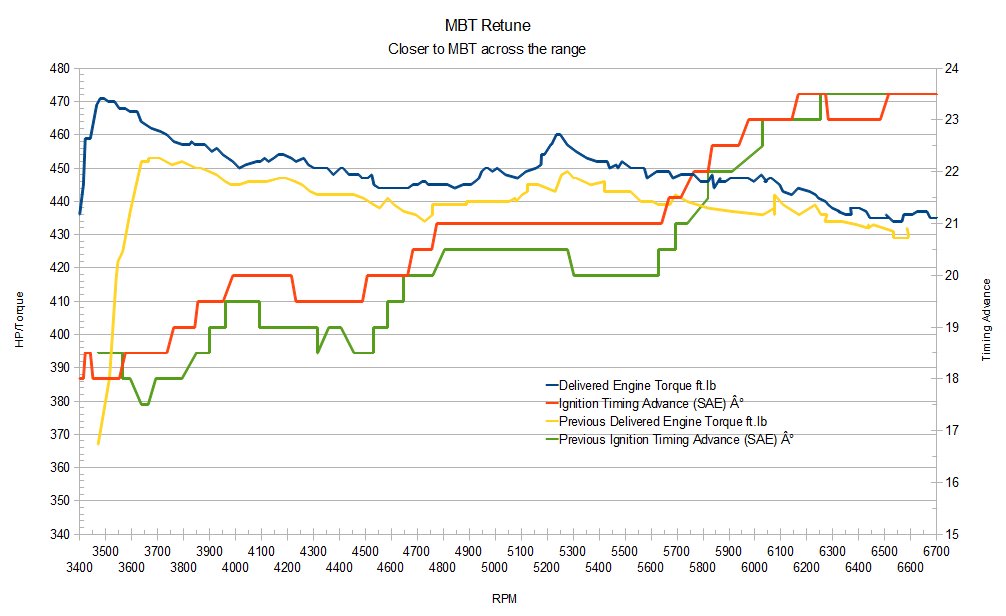
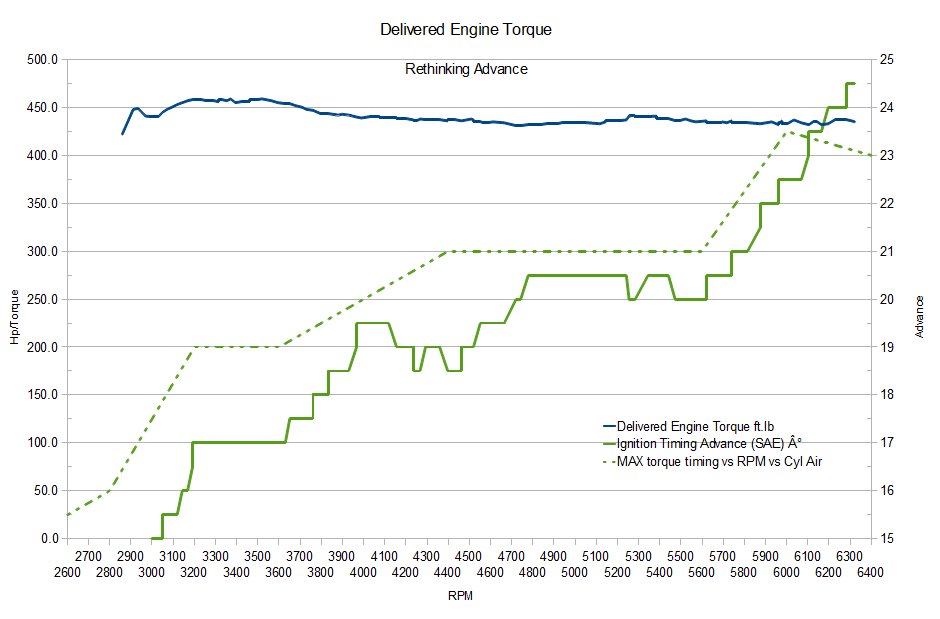
More timing makes more Torque
This graphic shows today’s delivered Torque in blue, and the previous delivered torque in yellow. The current total advance in red, and previous in green. This shows that by touching up the timing the V gained ~5 lb ft of torque throughout the range.
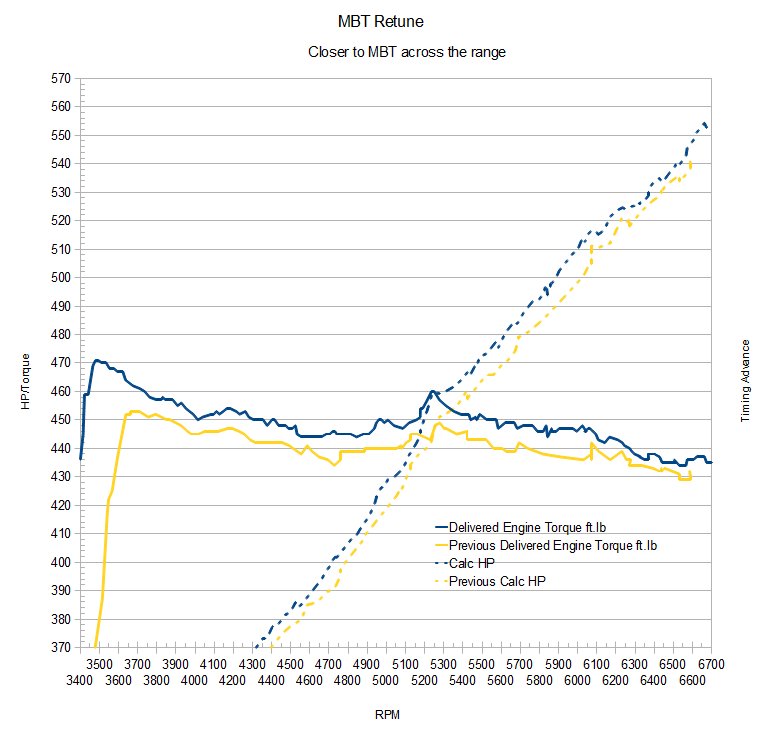
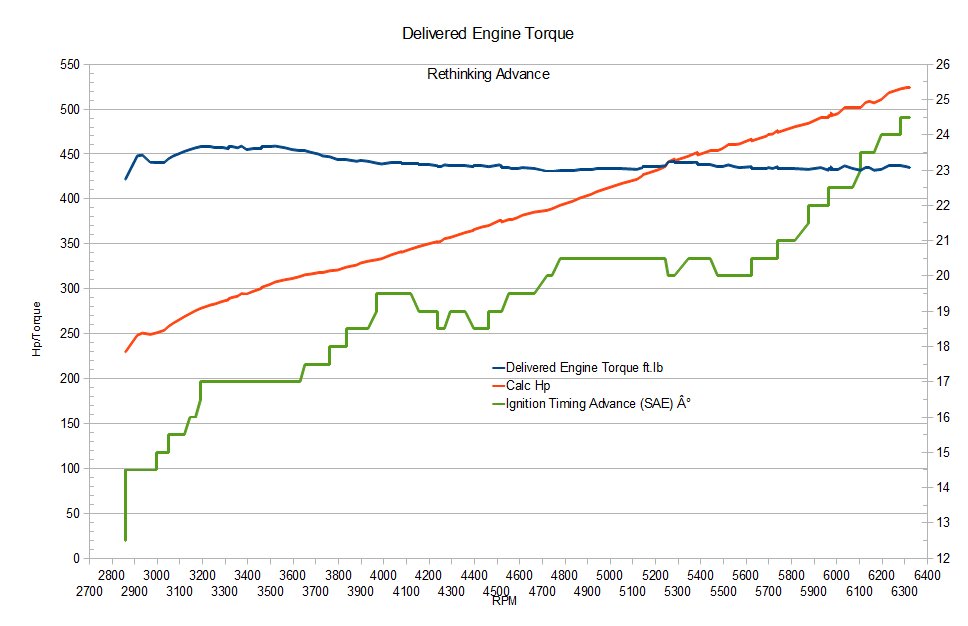
HPTuners data delivered torque & calculated hp comparison to previous
This graphic is the same info but with calculated HP compared current and previous. The actual high points were:
| Hp | RPM | Torque | RPM | |
| Previous | 541.65 | 6585 | 453.0 | 3663 |
| Current | 555.78 | 6710 | 471.0 | 3478 |
| Current | 545.6 | 6573 |
The previous test run topped at 6585 rpm where the 2-3 shift hit; today’s run was for 545.6 hp at a similar 6573 RPM.

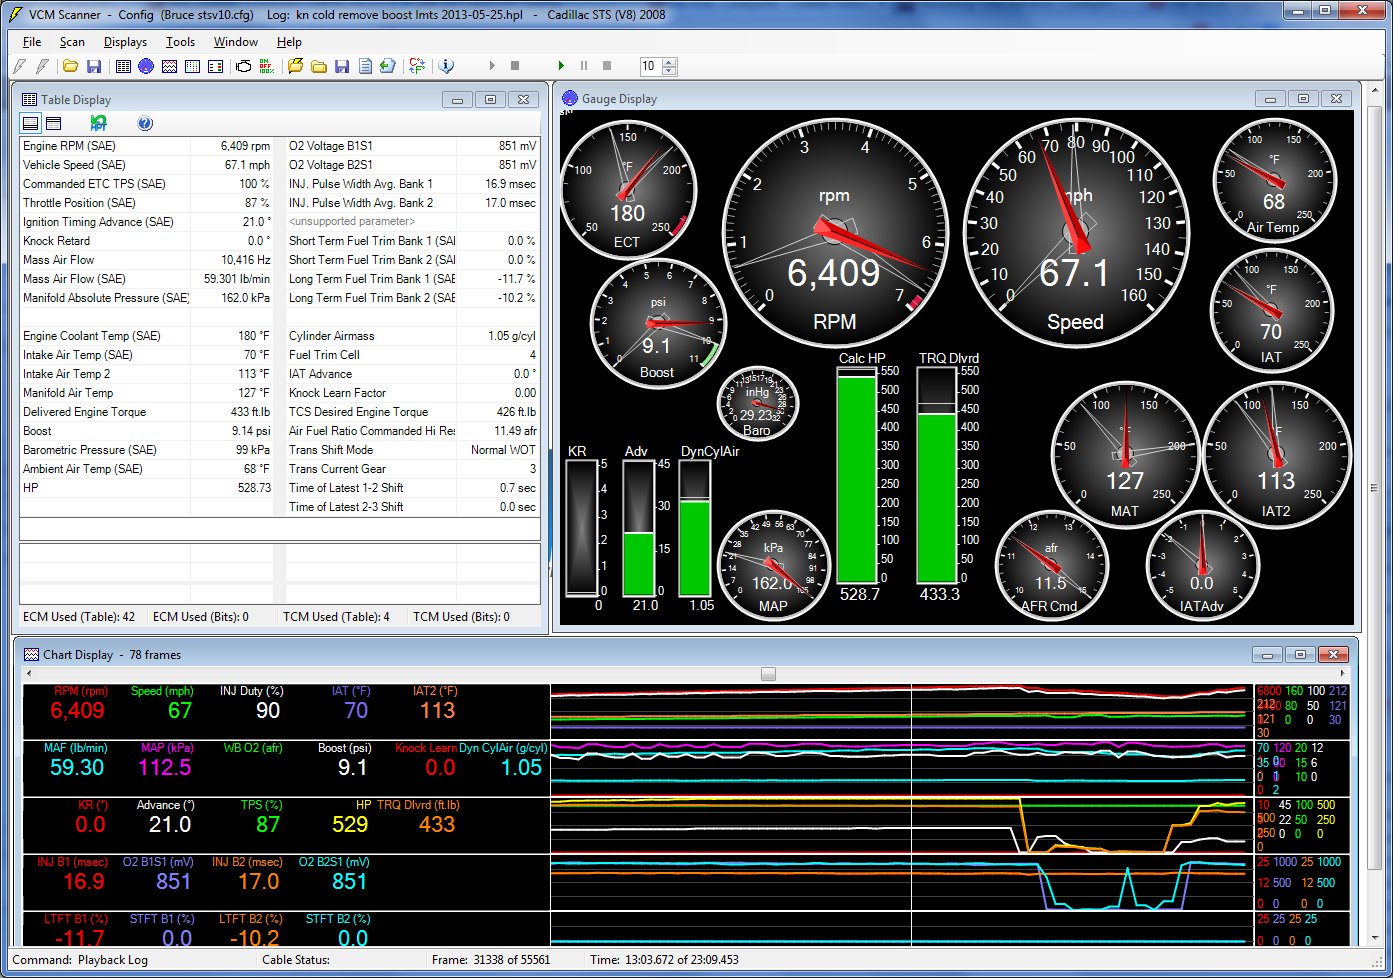
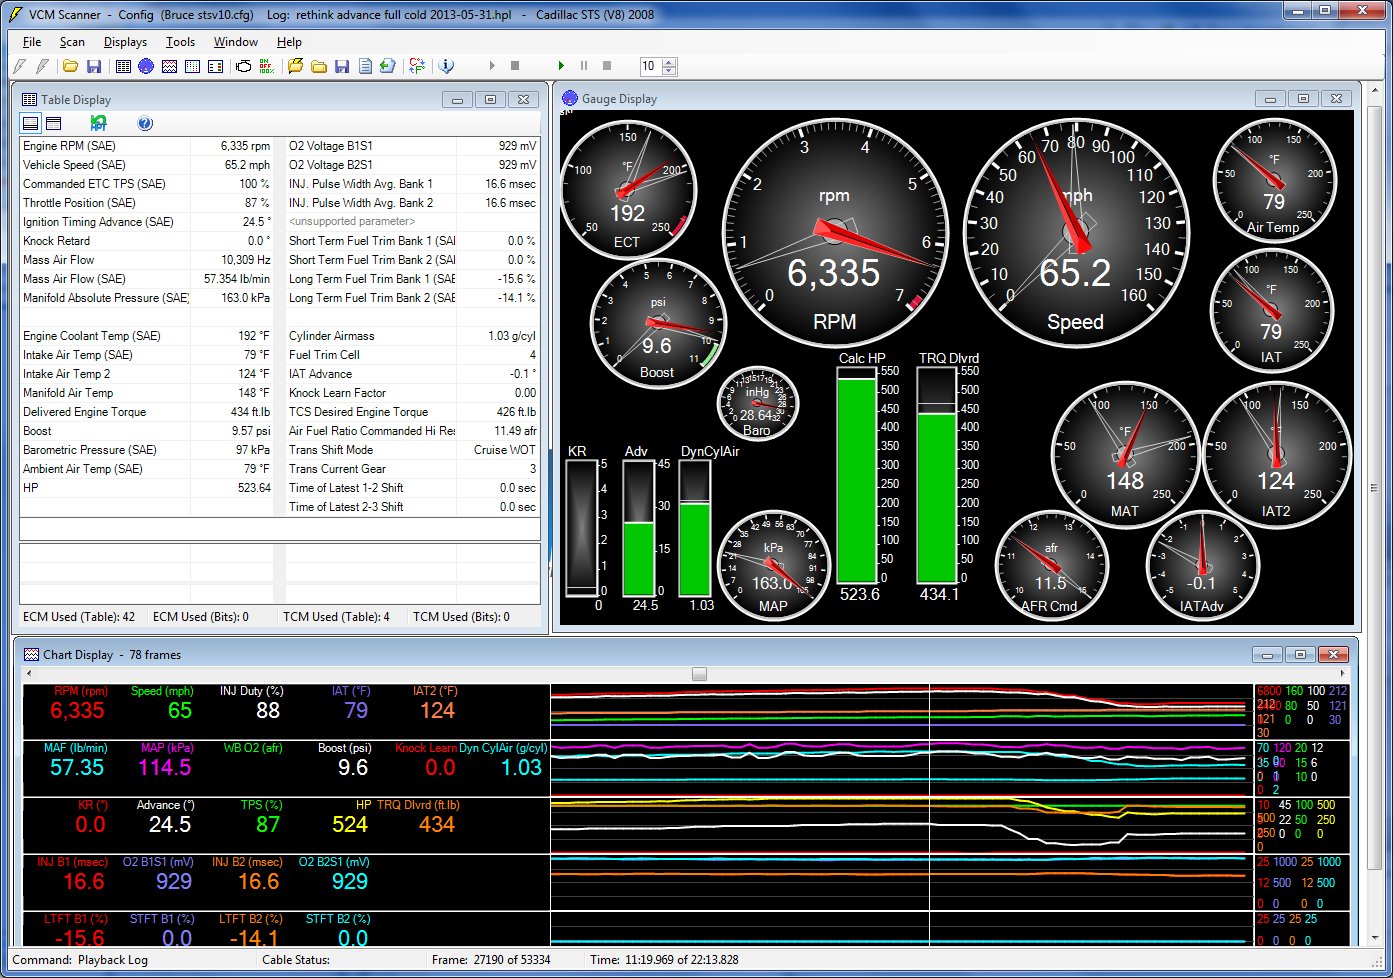
HP Tuners at Max Torque
This is a hptuners snapshot at max torque point
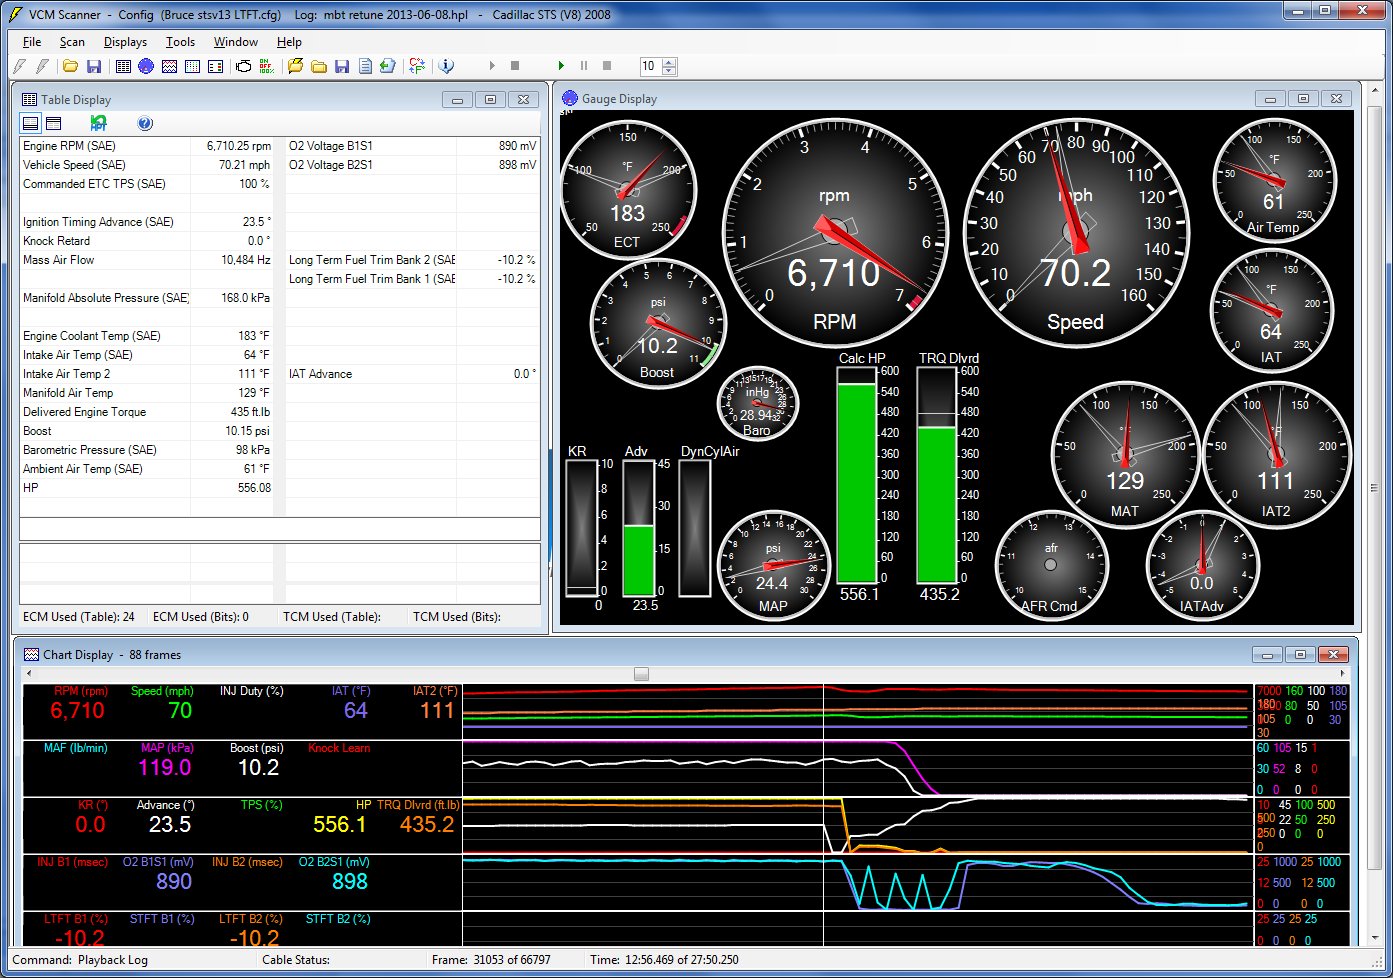
Hp Tuners at Max HP
and here is a similar shot at max hp point. I forgot to tell the car it was okay to shift to it redlined in 2nd for this test.

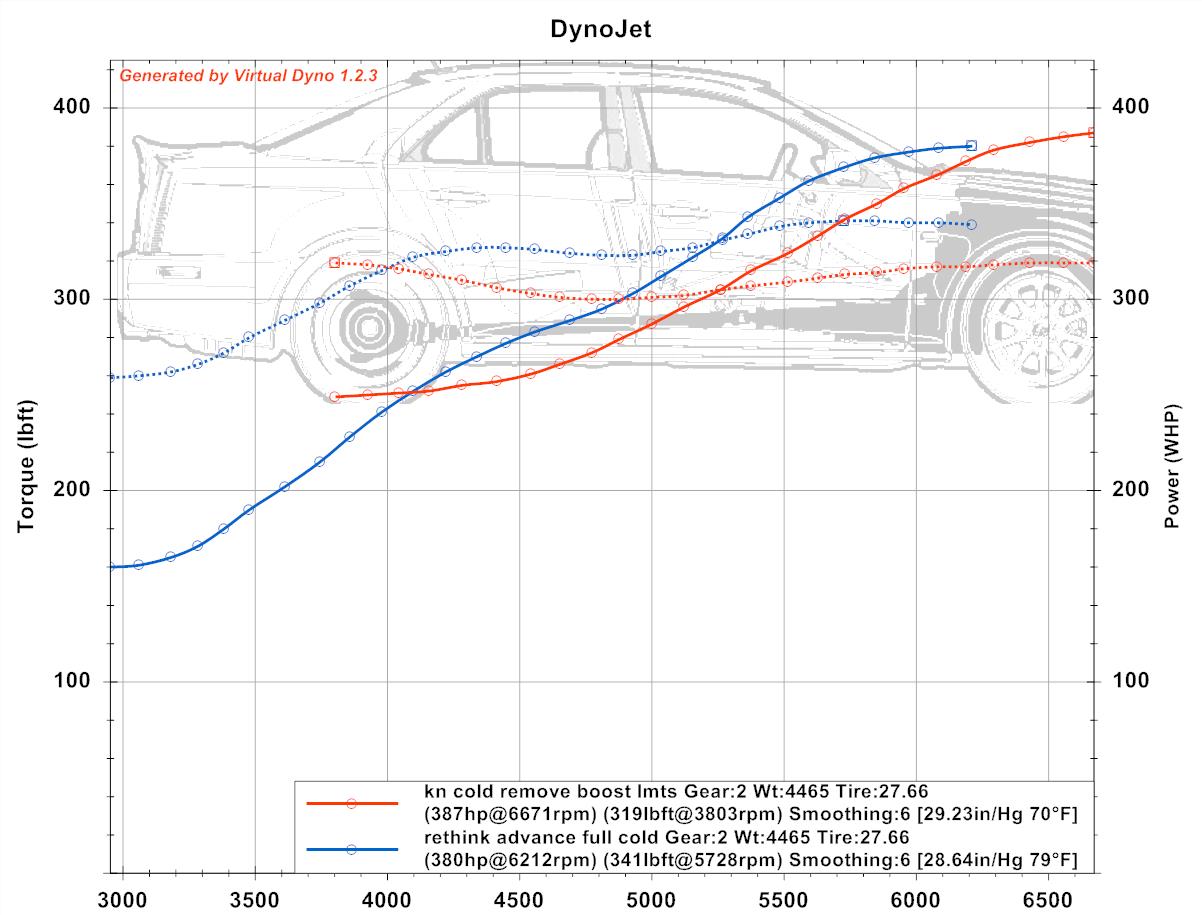
Virtual Dyno comparison of previous capture and today’s run
The virtual dyno run shows the low torque spike but only a 386 hp peak measured. Today’s run in red, previous odd run in blue.
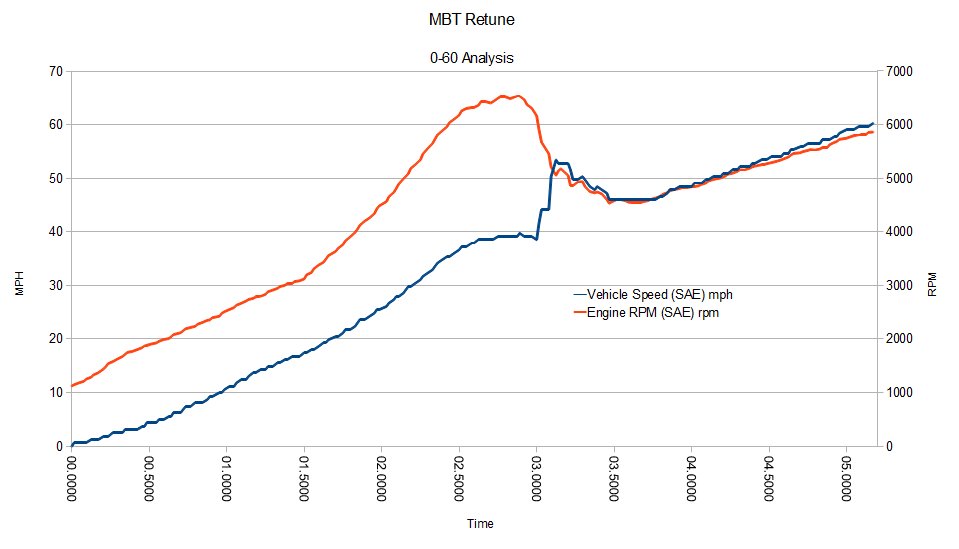
A 0-60 run measured from the HPtuners log took 5.17 sec without rollout. The PerformanceBox unfortunately didn’t properly capture the run so I don’t have a good figure for what it would have been with rollout.
| MPH | Speed |
| 0 | |
| 10 | 0.98 |
| 20 | 1.70 |
| 30 | 2.22 |
| 40 | 3.02 |
| 50 | 4.14 |
| 60 | 5.17 |
I really wanted to capture MAF lb/min but that was one of the things I did but should not have removed when lightening the HpTuners data table.
Summary
- Tuning the engine across the RPM range did improve the power output as expected
- The power gained by these slight improvements of ~5 lb ft shows that the engine is already operating close to optimal
- Some KR is observed at 3385 RPM and 4000 RPM, suggesting that the OEM tune is close to the knock limited max torque
My conclusion is that there some gain with additional timing, but that the OEM approach is very close to optimal and provides some margin for knock / detonation.
Update:
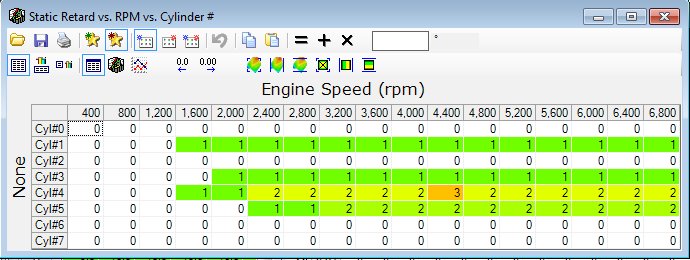
I reduced 0.5 degrees of timing advance everywhere there was a hint of KR. A follow-up run hot (more likely to knock) showed no KR in the tuned area.

Virtual Dyno comparison same day cold & light vs hot and heavy
To run the KR checks I also captured a 2nd gear test run. Although the runs are adjusted per SAE for temp and pressure the adjustments don’t have as much impact as temps do on the STS-V. The V runs ~22hp less power hot after adjustments, and 30+ hp missing without adjustments.
While getting my tables fixed I also found an S/C inlet pressure pid. This sounds like pressure at the inlet of the supercharger, and is in absolute pressure. So if we subtract this value from the barometric pressure in psi we can get vacuum at the supercharger inlet.
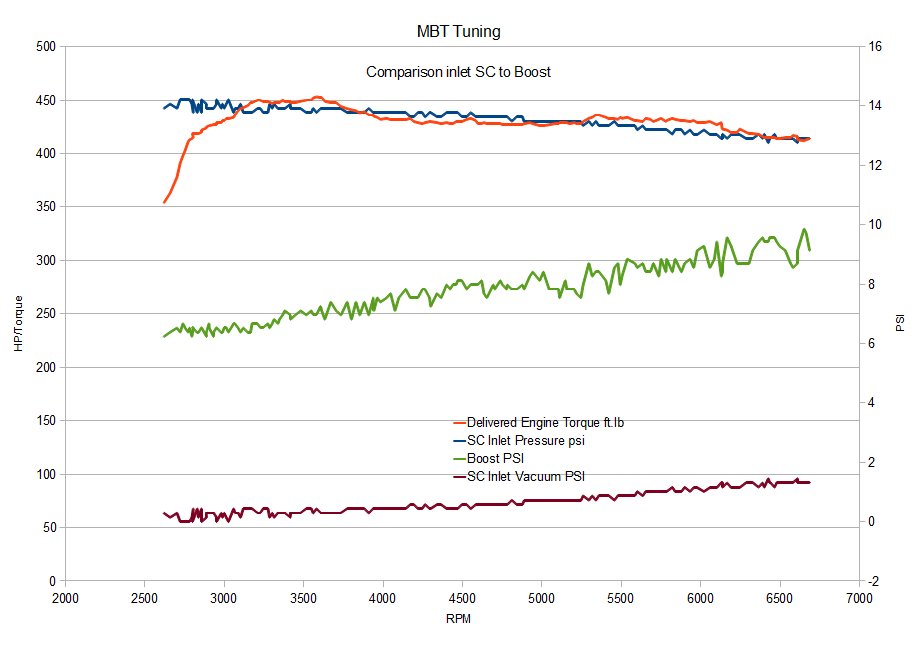
SC inlet pressure vs boost and RPM
The SC inlet pressure goes from 0 psi at low RPM up to 1.30 psi at redline. This figure appears to be ideal for planned air filter and intake testing.