In the tuning process adjusting total timing advance on a modern engine can be tricky. There are timing adjustments coming in from a variety of sources, which may change from one pull to another. To simplify the dyno process, it is inviting to isolate the total timing to a single table and adjust.
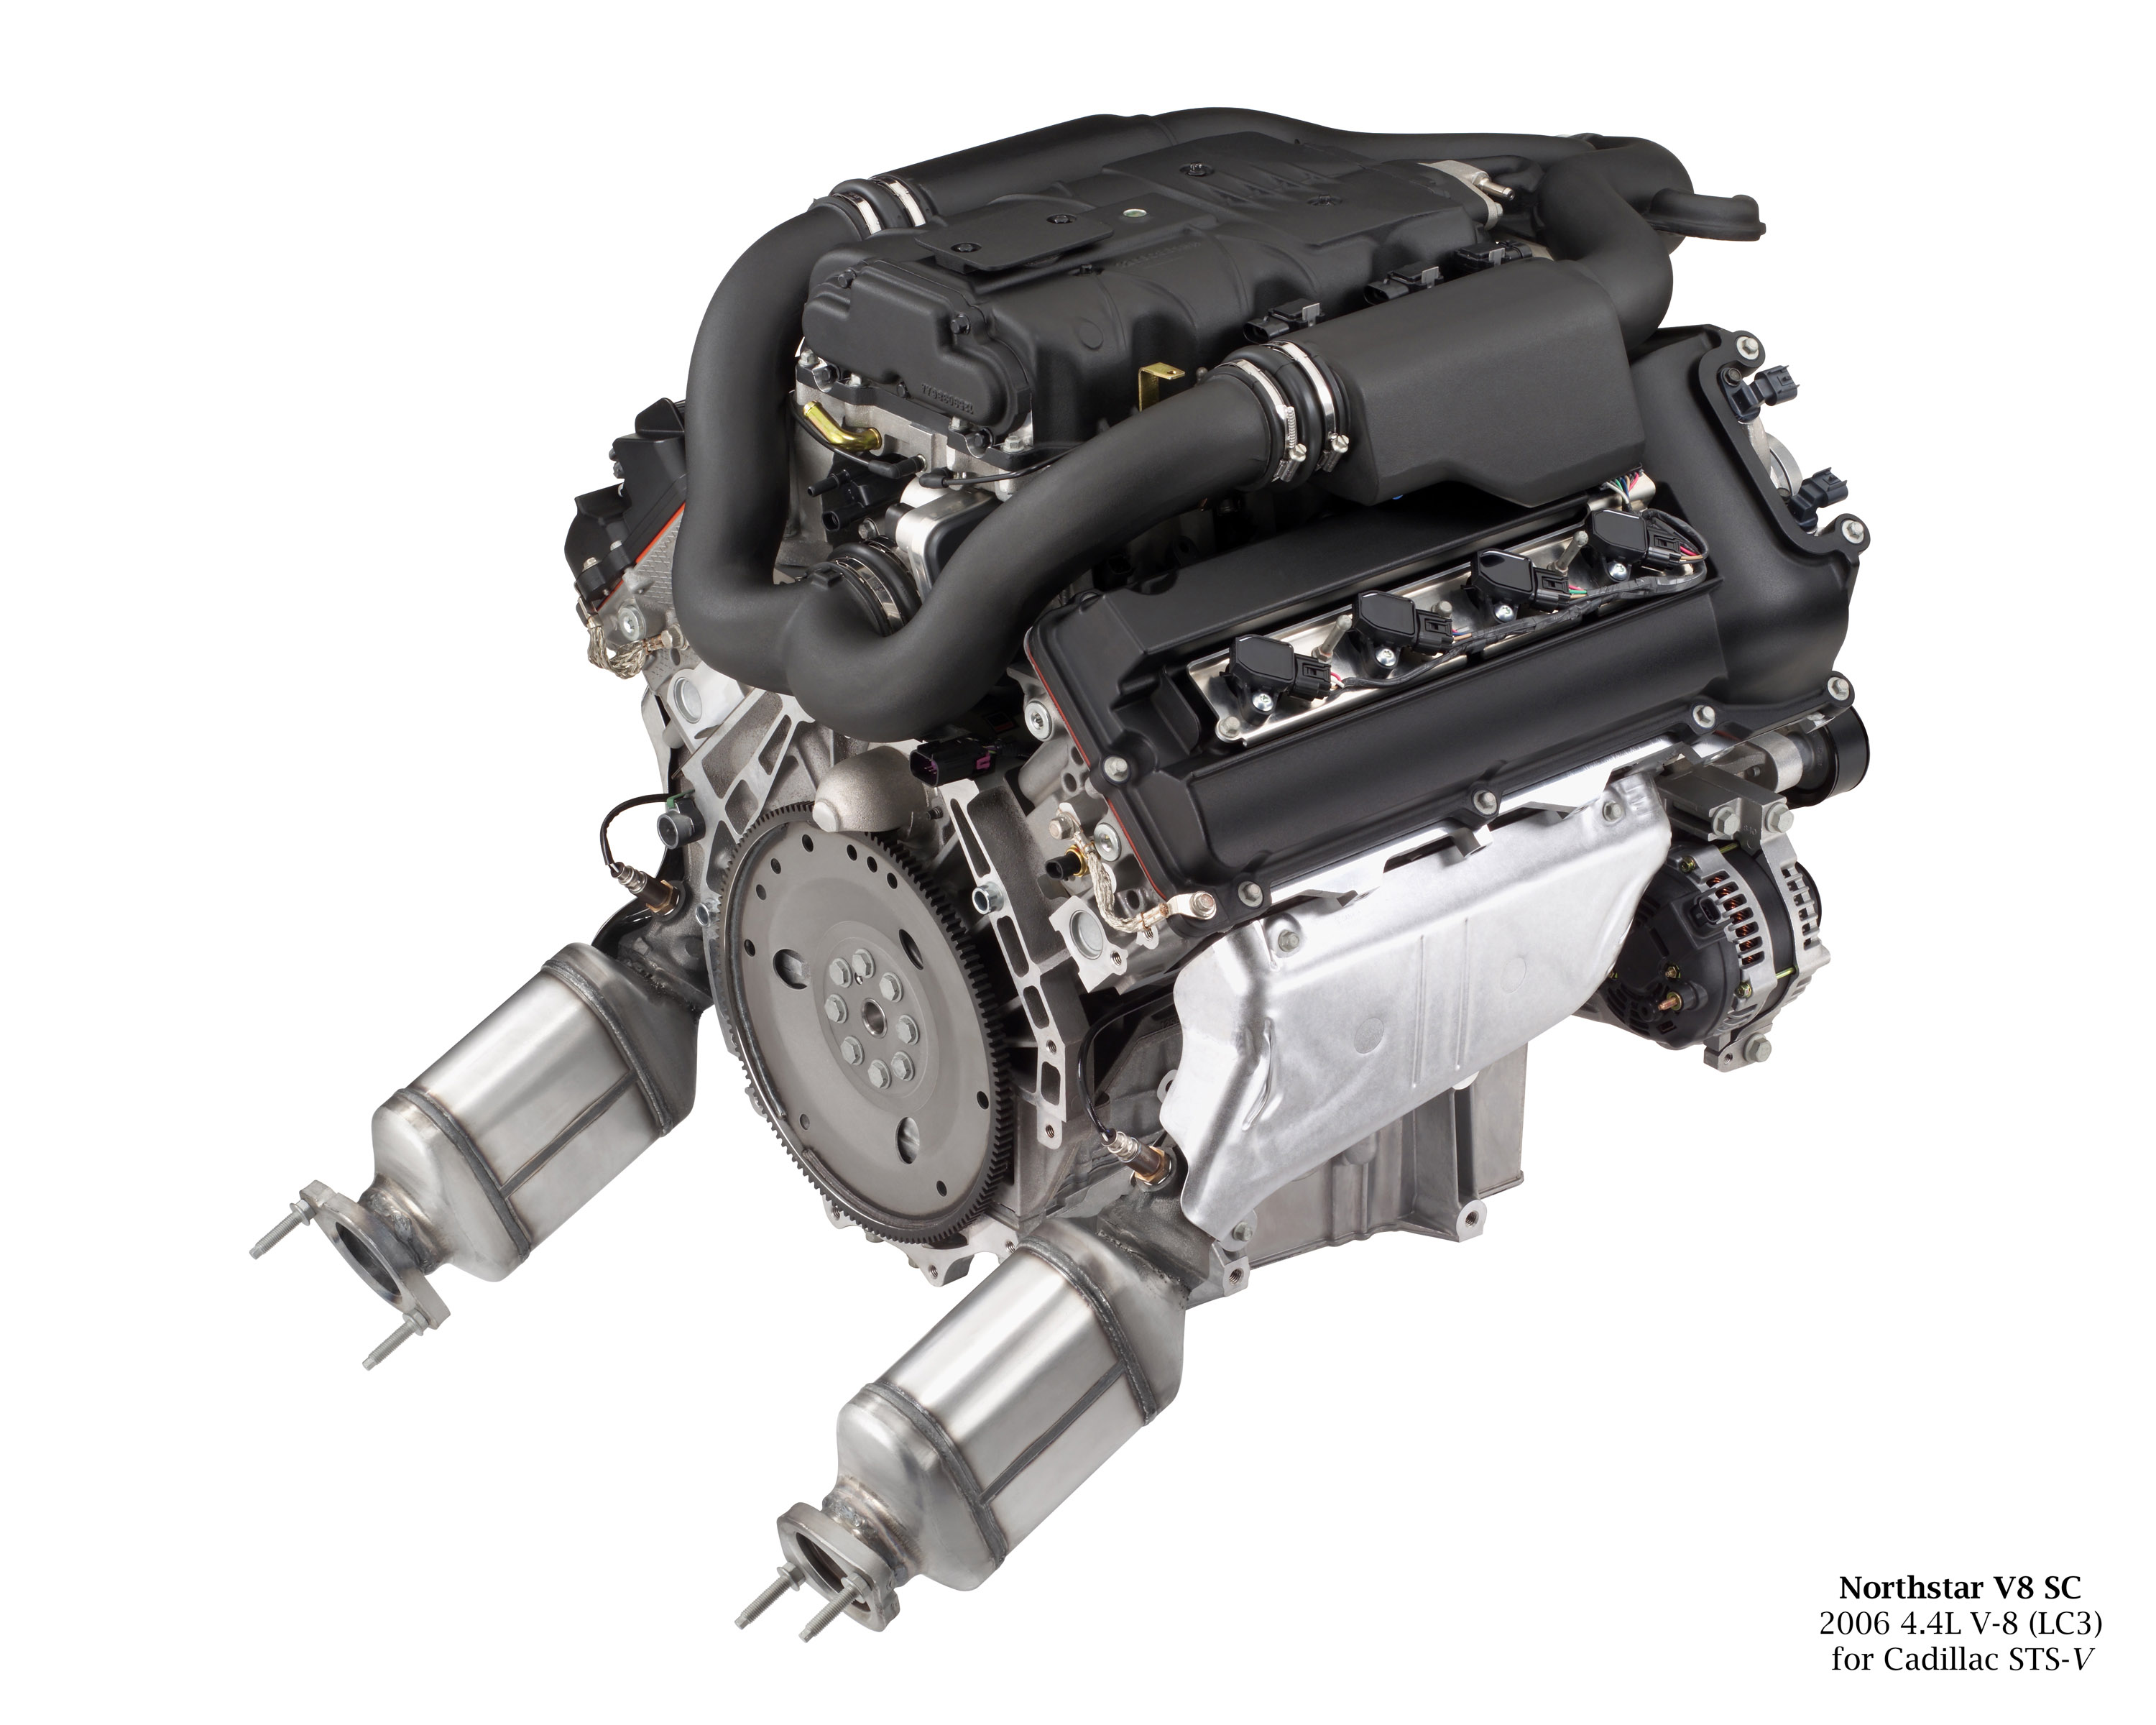
The files below relate to my 2008 Cadillac STS-V with the DOHC, VVT, supercharged 4.4L V8 engine:
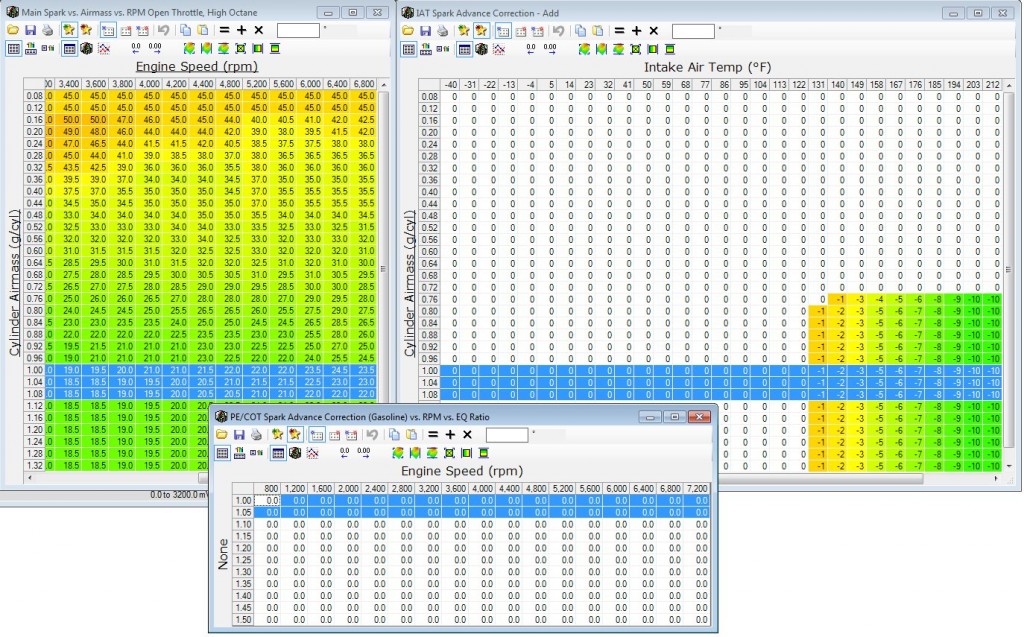
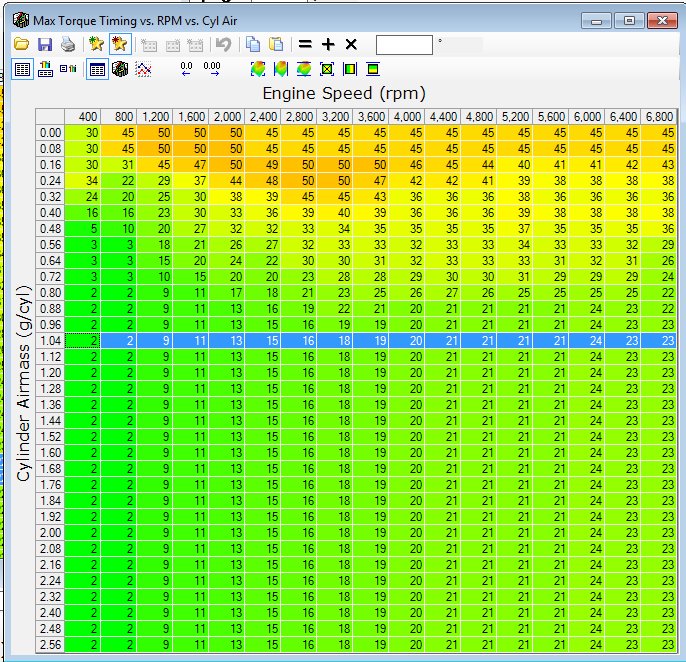
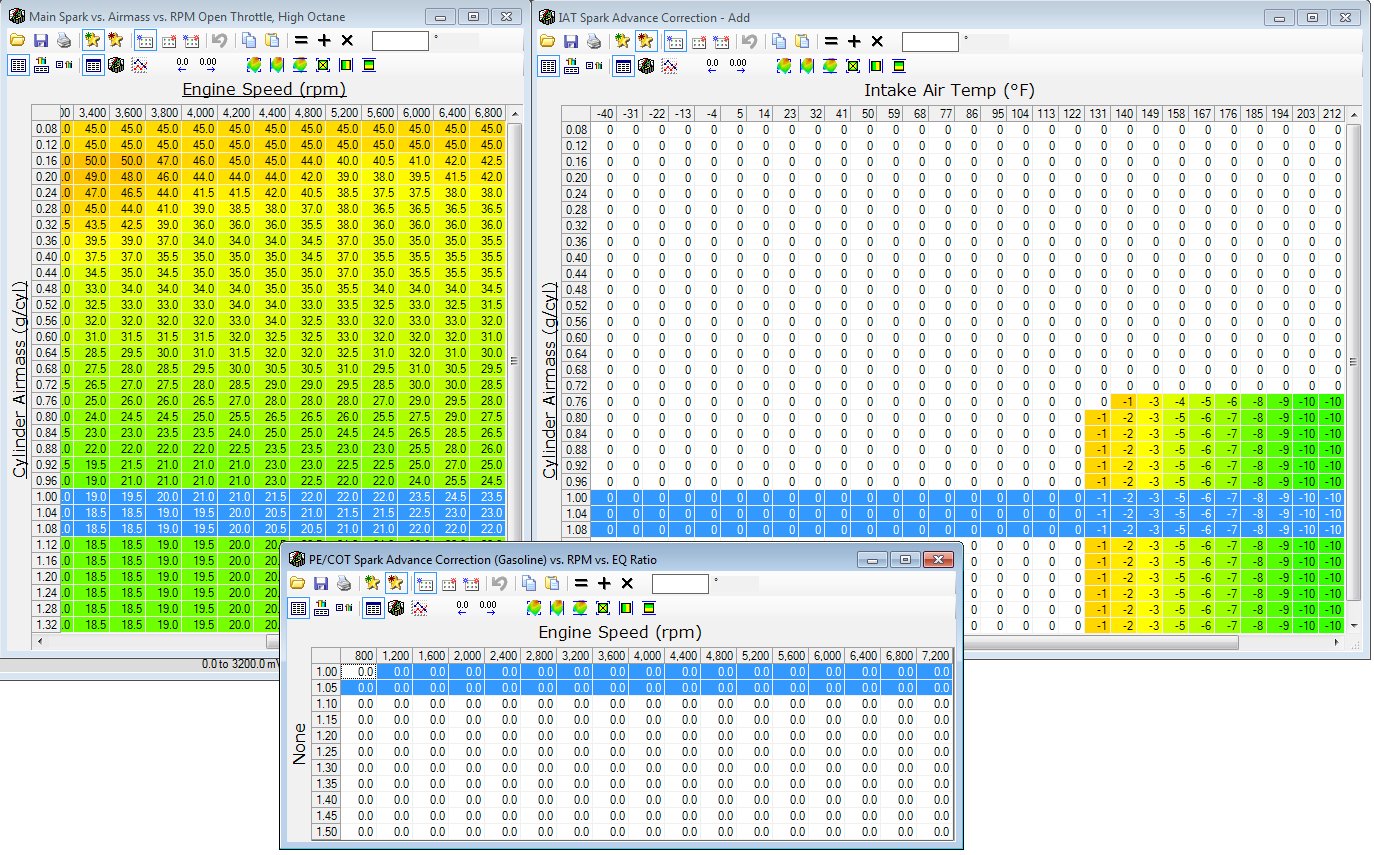
Tuned Timing — added ~2 in the main (left) table, removed IAT timing below 122F (right), removed PE/COT timing adders (bottom)
However, holding all the timing on the main table is not ideal for how I would prefer for the engine to operate — we actually want timing from each table and adder because they offer diverse inputs for specific situations. For example, I prefer to add timing via the intake air temperature table (IAT), which will only add timing only if the air is cool.
The image above shows an HPTuners screen shot of 3 related timing tables after tuning.
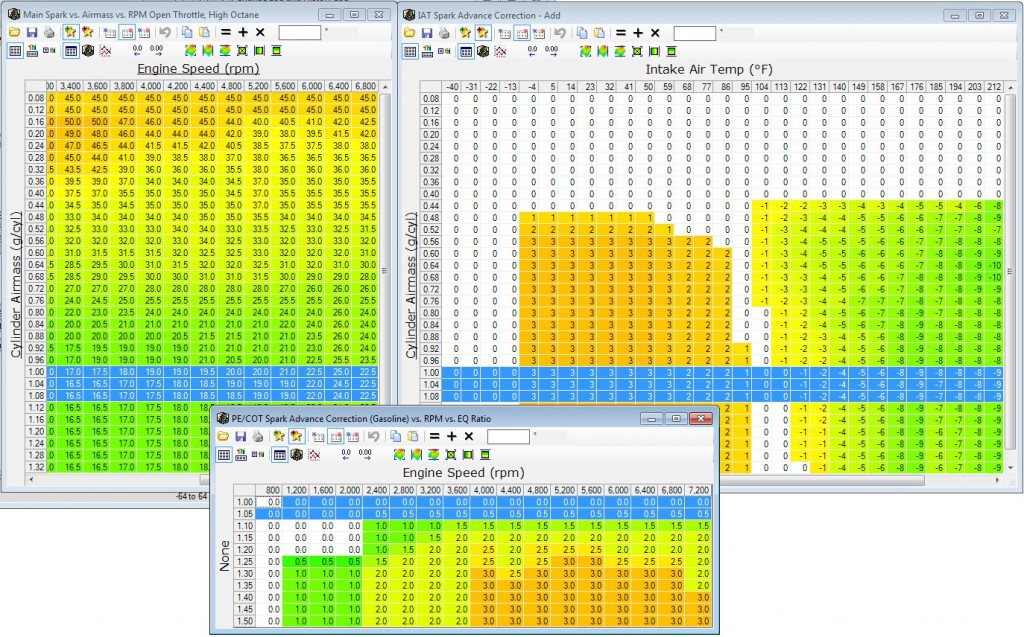
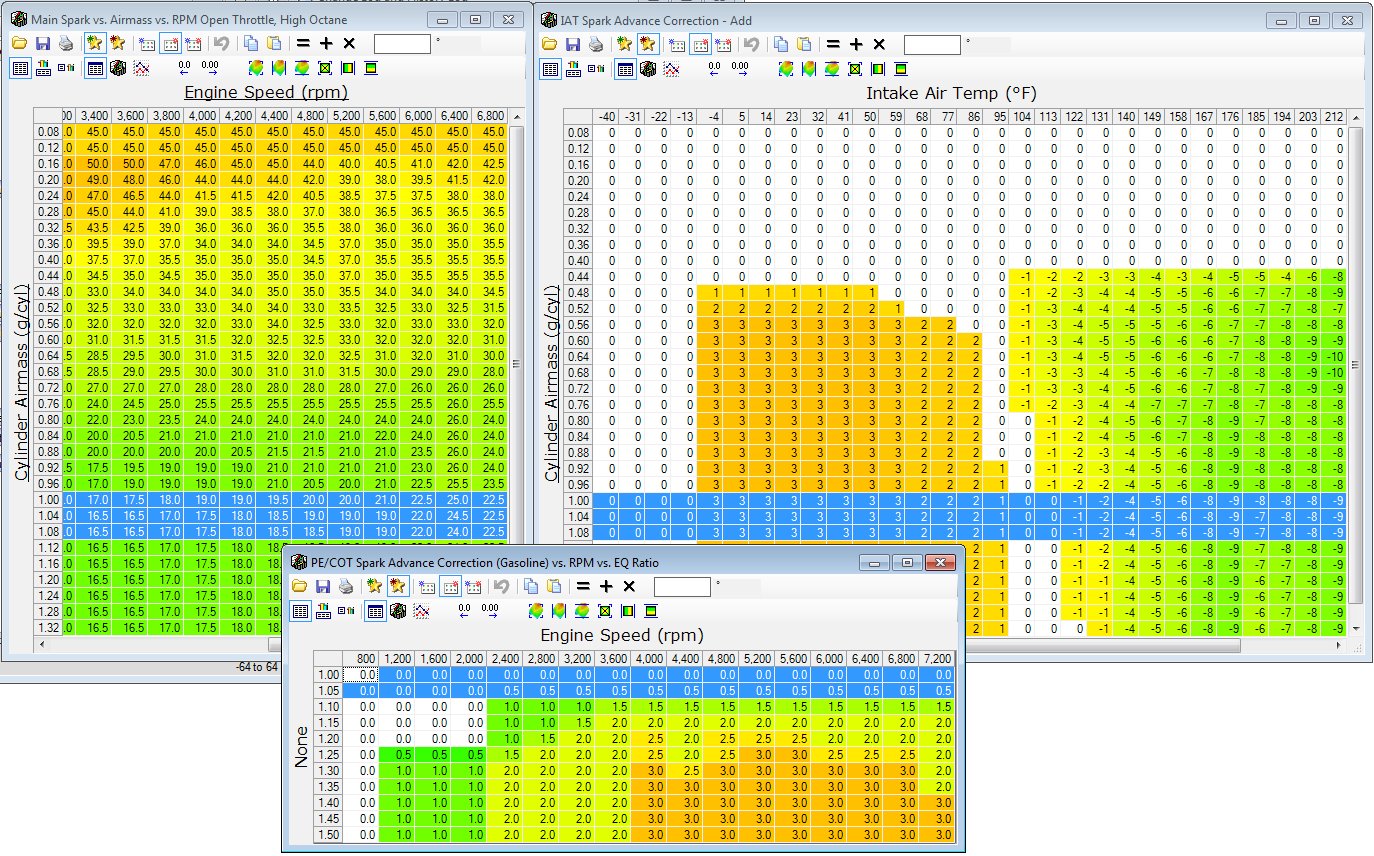
Timing for OEM calibration file
This second image shows the same tables in the OEM calibration. In the OEM tables, the main table had slightly (2 deg) less advance, the IAT table adds advance below 95F and takes out advance above 122F, and the PE/COT table adds advance above 1.05 g/cyl.
Finally, the following table shows just delta values between these 2 tunes, or differences in the files:
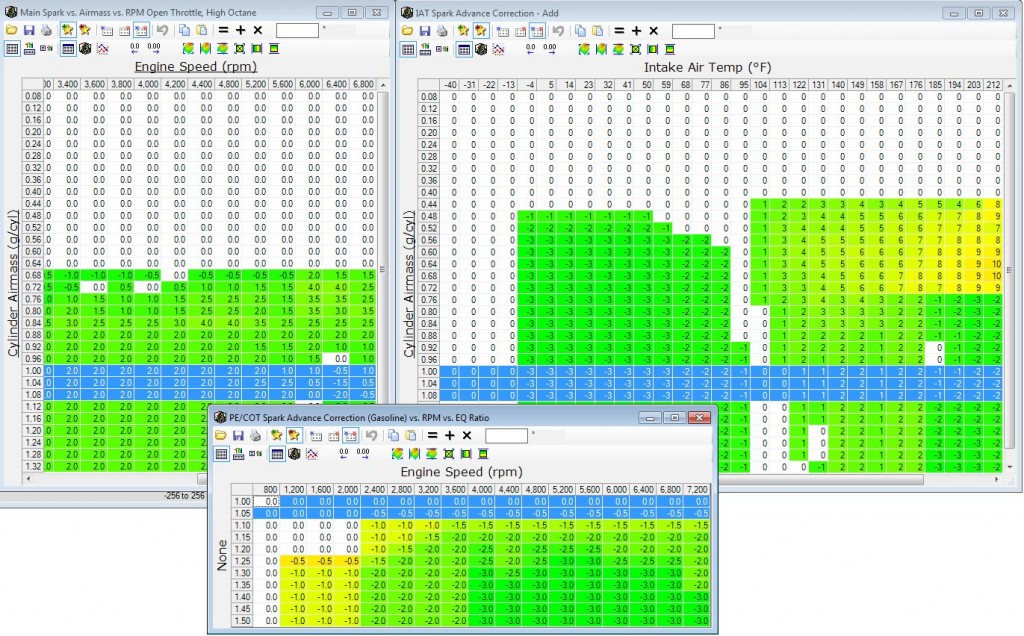
Difference by comparison — tables show just the +added timing or -removed timing for the tuned vs OEM
Here is the test for the ‘tuned’ timing: we can see in scans that at 6409 RPM the STS-V is running total timing of about 21 degrees advanced at 1.05 g/cyl.

HPtuners at 6409 RPM shows 21.0 degrees total advance
Looking at the Tuned tables (top ones above),
- the main table (left) has 23 degrees at 1.04 and 22 at 1.08, so likely uses ~22.75 at 1.05 g/cyl.
- the IAT2 was 106F on that run, so the IAT advance was 0.
- the PE/COT table is stripped in the Tuned file, so no change there.
- No knock retard (KR)
- So where is our missing timing, 22.75 from these tables vs 21 degrees observed?
There is a static retard vs rpm vs cylinder table which is unchanged from Tuned to OEM:
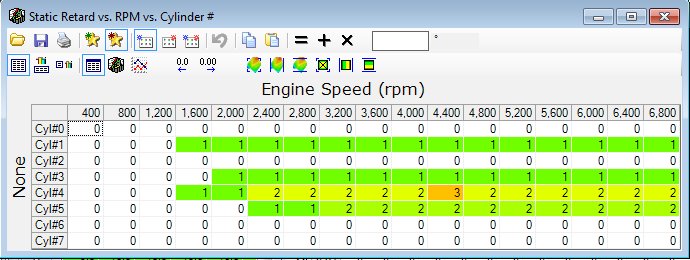
Static Retard vs RPM vs Cylinder (degrees of retard)
which is pulling 2 degrees of retard (minus advance) from a couple of cylinders. This appears to be an as-designed adjustment to the timing by cylinder and RPM. The SAE total advance appears to include that 0-2 degrees retard for 23 – 2 = 21 Degrees as tuned.
Going back to the OEM files, at 6400 RPM and 1.05 g/cyl we will expect:
- Main timing table 24.4 degrees
- IAT Table 0 degrees
- PE/COT table 0.5 degrees
- Static Retard -2 degrees
- Total advance: 24.4 main + 0 IAT + .5 PE/COT – 2 Retard = 21.9 total
So although the tuned file added +2 degrees of advance to the main table, in this circumstance the result was it reduced the timing slightly. In colder air the tuned table had also stripped the low-temp IAT advance adds, so it would lose power there.
Next I am restoring the various advance tables to OEM calibration. I’ll log data running the OEM advance tables. Then I can look at adding a bit of timing via the IAT table as a way to proceed in a fail-safe manner. I also need to recalibrate my MAF to get the LTFTs back slightly negative.
Feedback
Any advice or feedback? Am I missing any logic or key tables in my timing thinking?
Update:
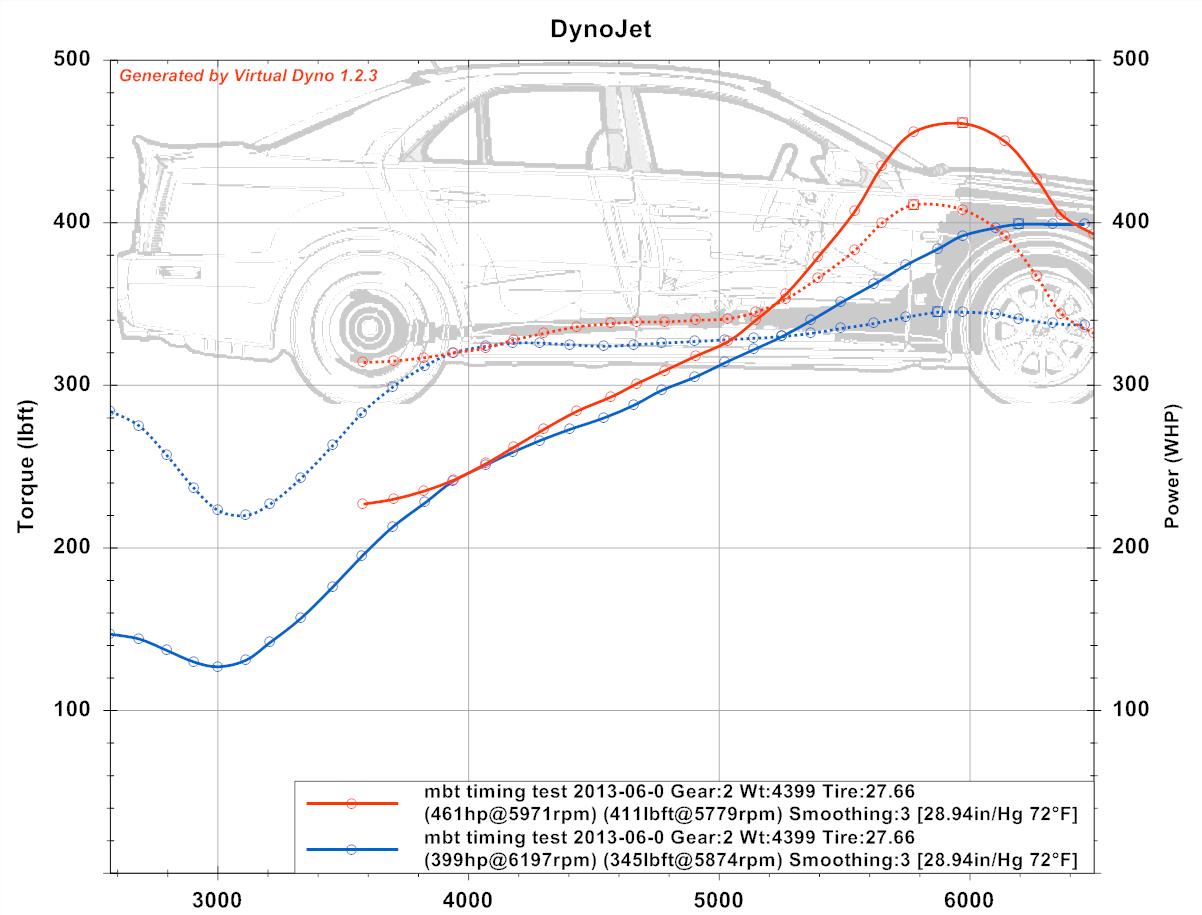
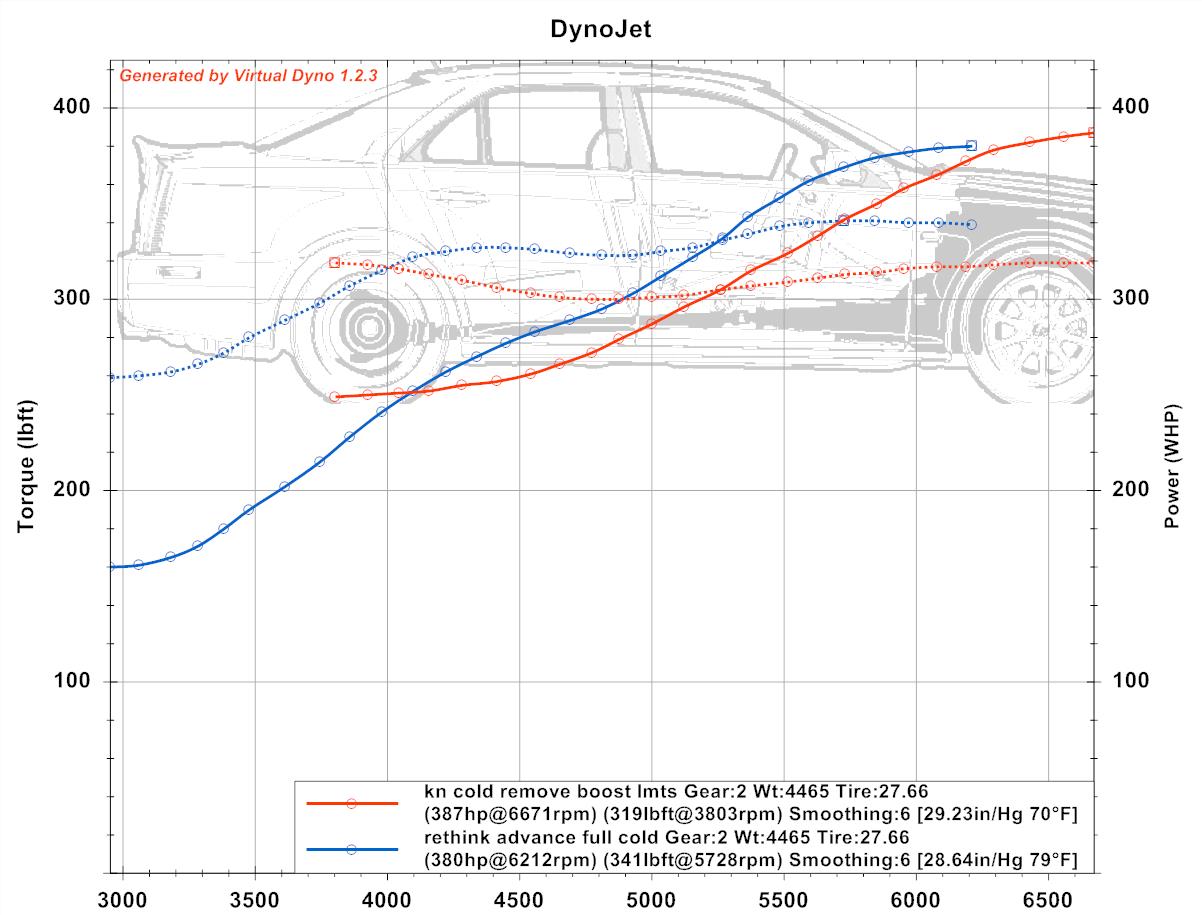
My initial run with the timing strategy adjust looks promising
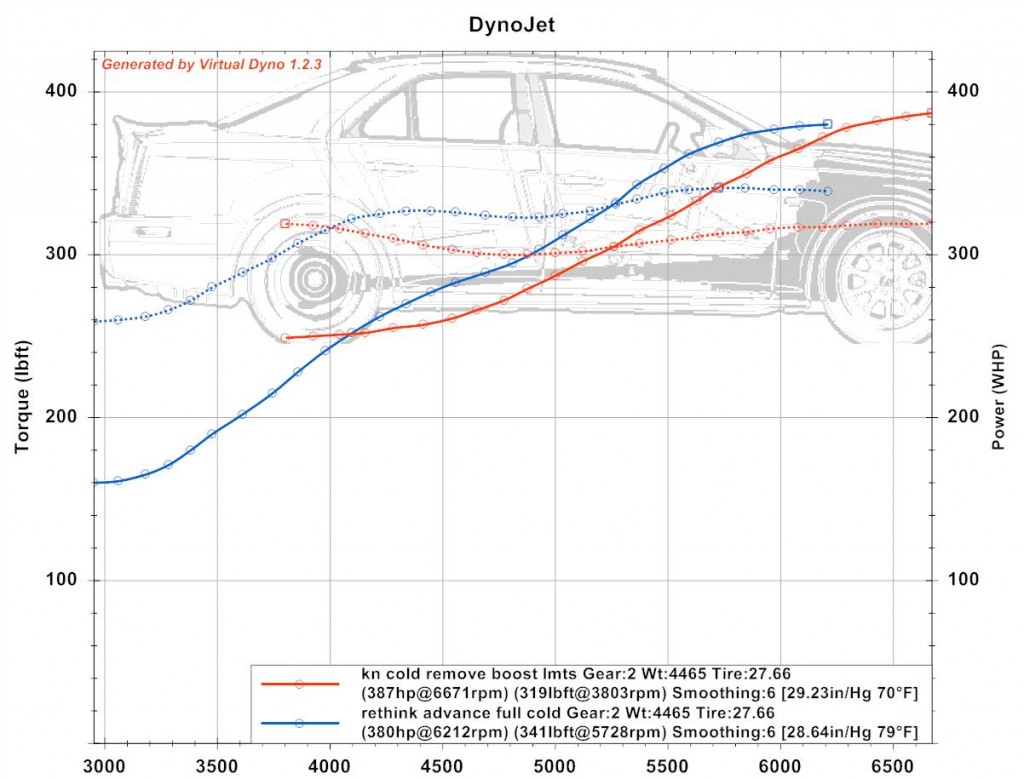
What this graph shows is a comparison of today’s run (blue) with a previous tune (red), both cold (not heat soaked) and full of fuel. Hotter day today, lower baro. Although the peak hp was higher for the previous run in red, the today’s result is 20-25 whp above the previous for much of the run. Today I let the transmission shift 2-3 instead of red-lining in 2, so that muted the high RPM result.
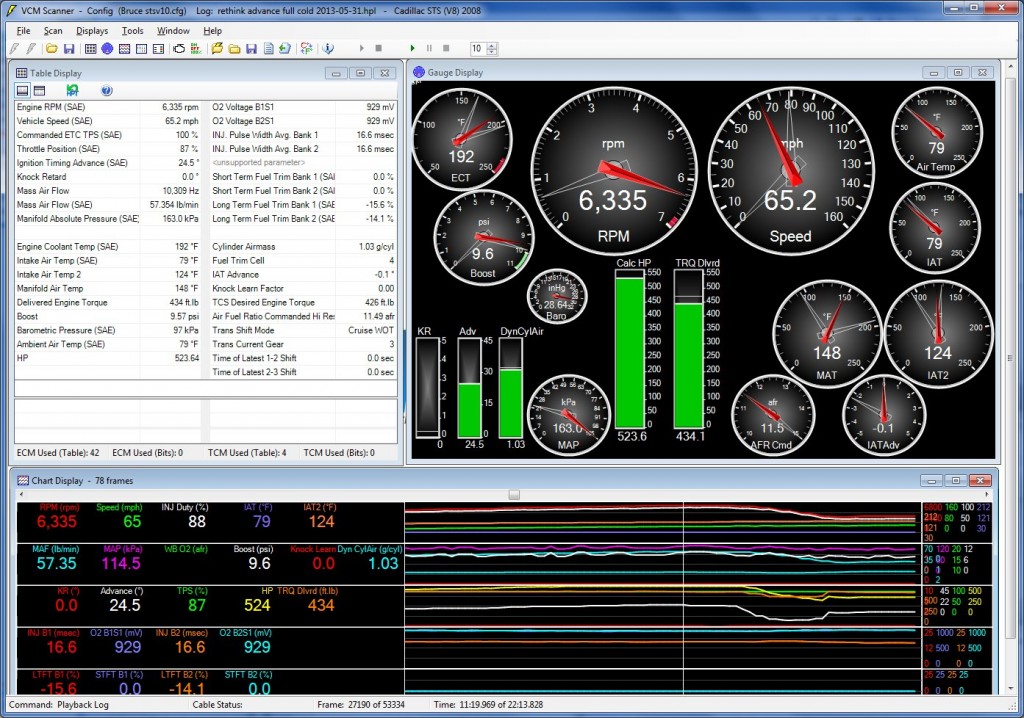
Total Timing snapshot after retuning
Total timing for the run ran 24.5 degrees of advance, with 0.1 IAT2 retard at that point. I’ll have to study to see why this was more than our expected 21.9 degrees. We were in a slightly different pressure zone — 1.03 g/sec dynamic cylinder air (57.35 MAF lb/min) vs 1.05 on the previous run / day.
A screen capture from the previous run at a similar 6339 rpm:
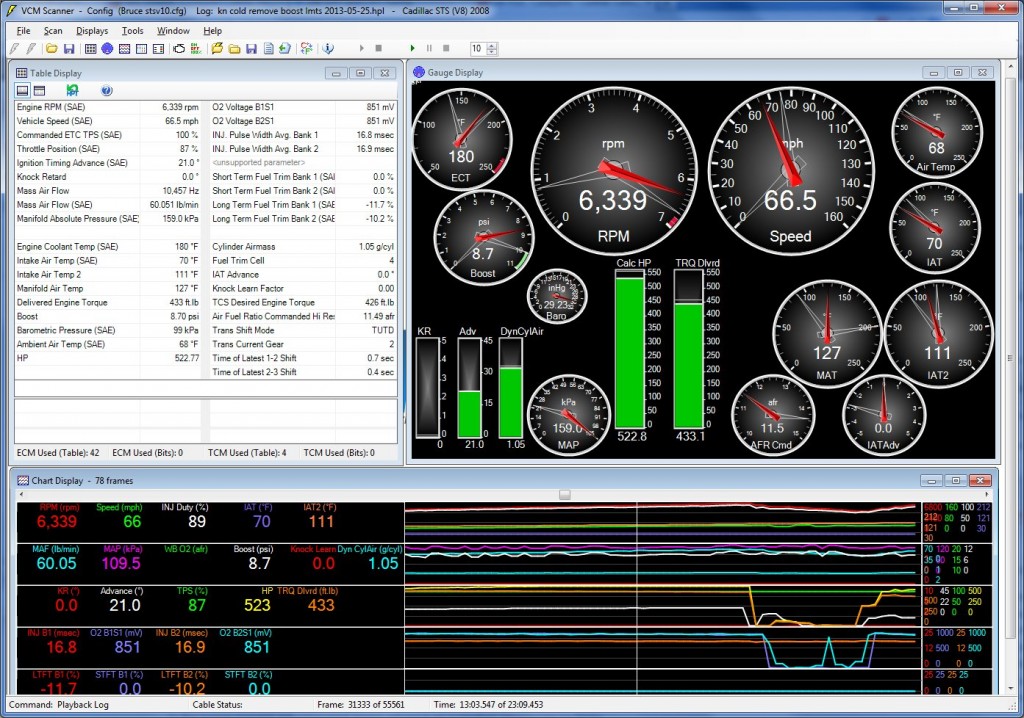
Previous cold run HP Tuners display
Shows a comparable set of readings.
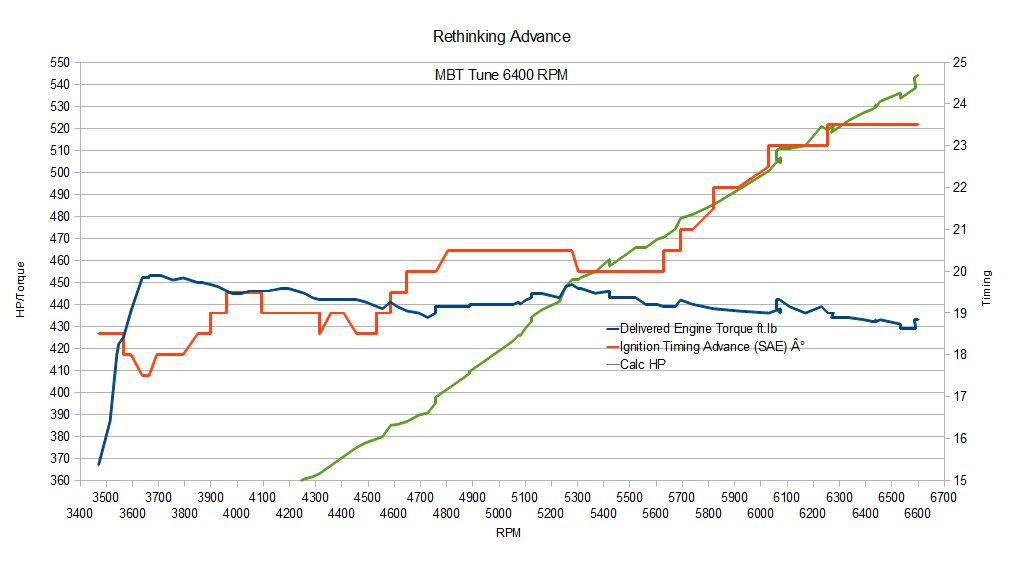
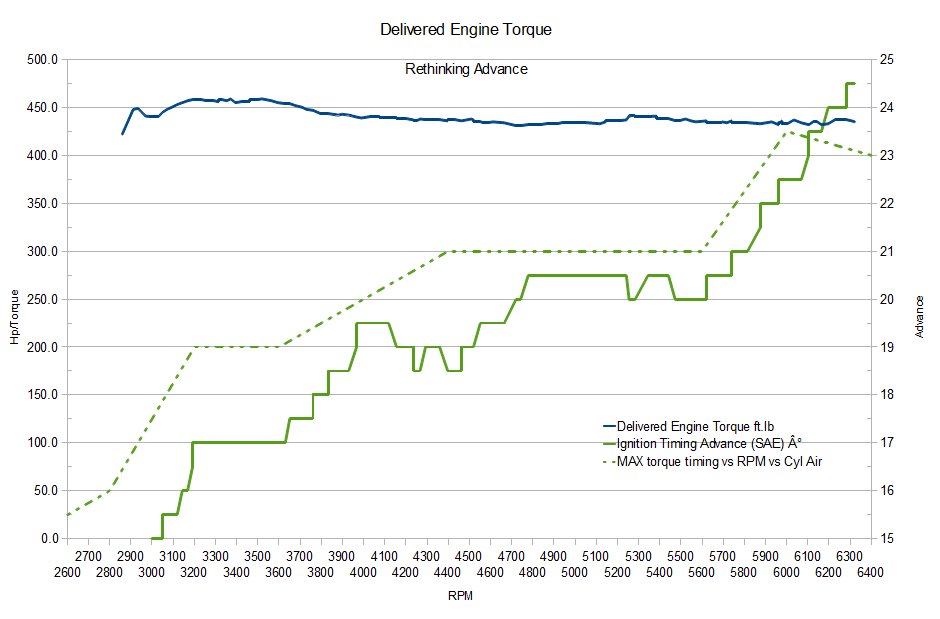
Next as an exploration I graphed delivered torque vs total ignition timing:
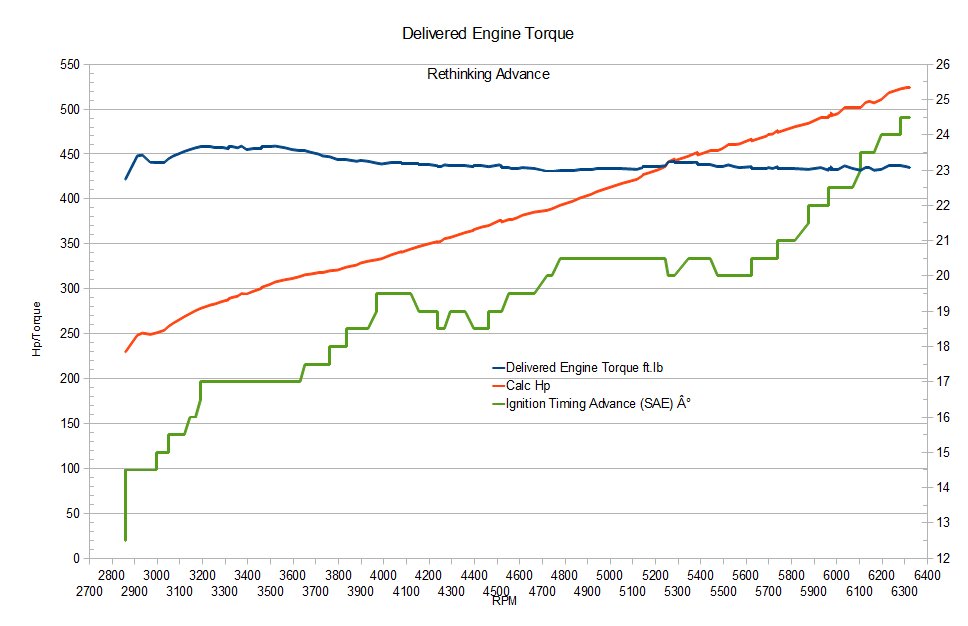
Delivered Torque and Calc Hp vs Total Timing
which shows the complexity of the total timing result across the RPM band.
Max calc values were 459 ft-lbs at 3371 and 3520 rpm, 523.6 hp at 6322 rpm (gear shift).