Topics: Escalade-V or VSport, XT5 next looks, LH2 Cam Timing

Topics: Escalade-V or VSport, XT5 next looks, LH2 Cam Timing
Today’s road test is a repeat of the previous test to add to the baseline for Tune 5. The only change from previous was to decrease the TUTD shift speed by 1 mph to 81, and to change the PE ramp from 0.1 to 1.0 (range 0.01 to 2). This value effects how quickly the engine attempts to reach the PE fueling value. Since the commanded air fuel ratio is now set constant from low RPM to high, we would expect this to have impact only just after wide open throttle is reached.
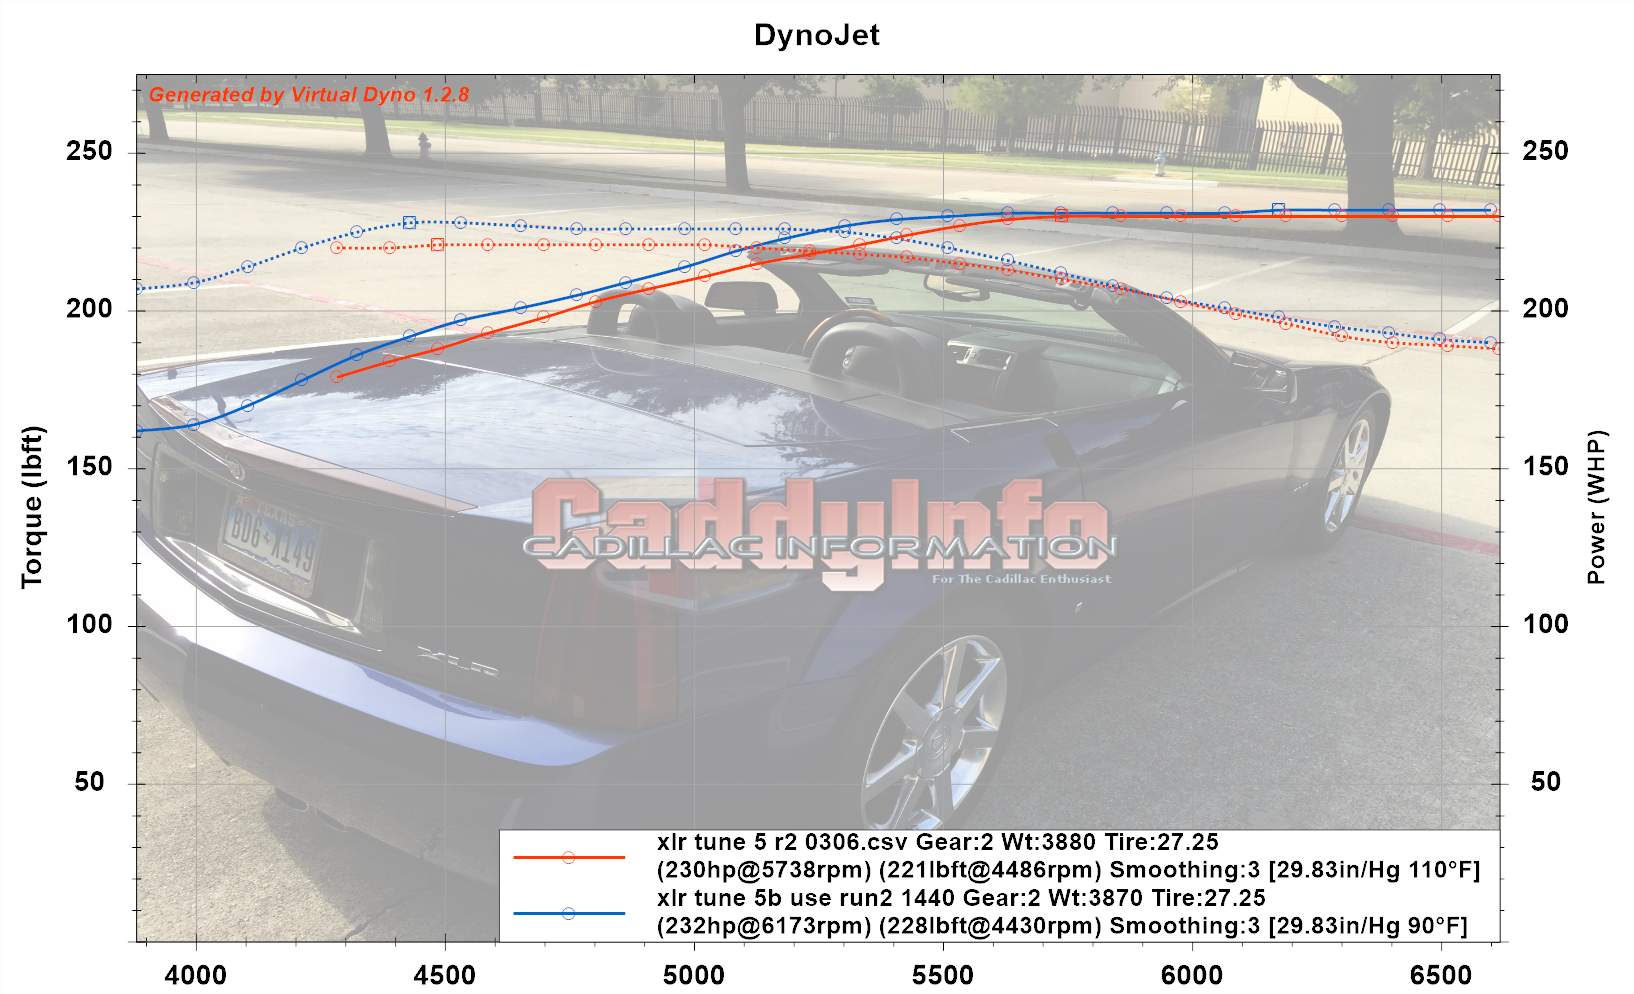
Today’s run is in Blue, and we are comparing to the Tune 5 run in red. What I see is the runs are very close. Today’s somewhat better torque may be an (additional) effect of cooler air, or it may be helped by the PE ramp up. We’ll see how other runs look — certainly I don’t see any disadvantage from the higher PE ramp.
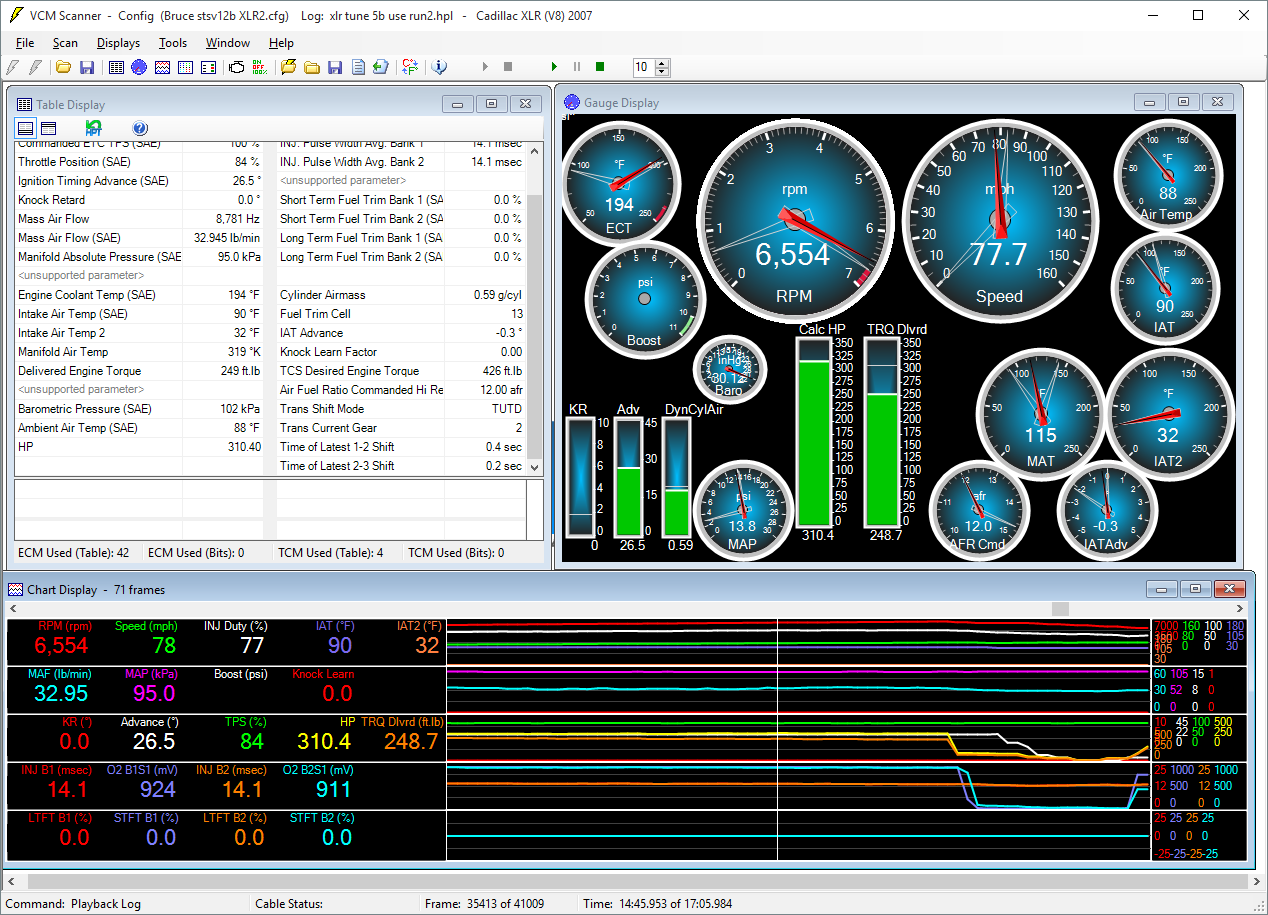
The calculated HP peak was at 6554 RPM. ECT 194F, ambient 88F, Intake air 90F, MAT 115F. Some IAT retard. Peak advance ~26.5 degrees.
Madtuner.com offers a tune for the LH2; they did work on a 2005 STS in 2012 and showed this dyno chart for before / after:

This looks very similar to what I am seeing with the LH2 in my XLR. They had some glitch in the base tune, but I am looking at the shape of the before & after curves — the HP peaks at 5400 or so and is flat until 6000. They stop the scan at 6000 rpm for some reason — I suppose because the engine wasn’t making more power past that. They don’t mention the specifics of their tune.
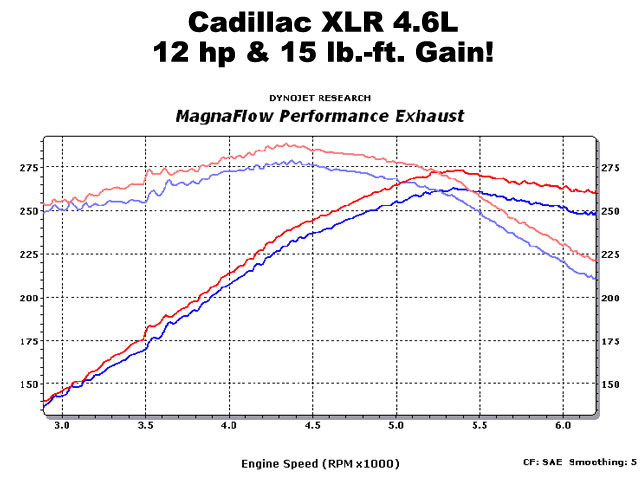
Cadillac XLR 320 hp picks up 12 whp with Magnaflow catback
The Magnaflow performance exhaust for the Cadillac XLR shows a similar shape in the before and after — HP peaking near 5400 RPM and dropping to past 6000 rpm.
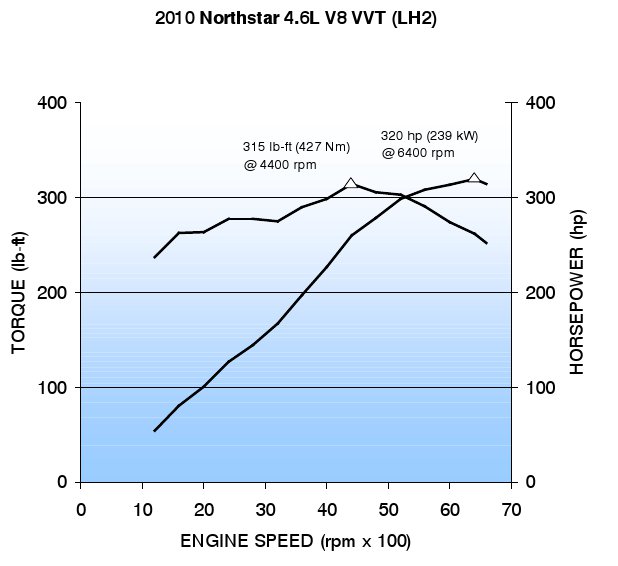
320 hp LH2 Rear-wheel Drive Variant
GM powertrain showed the LH2 continuing to improve hp until 6400 rpm. Redline is at 6700 rpm. Note that the GM plot is an engine dyno, and the Madtuners and Virtual Dyno plots are hp at the rear wheels, so we expect them to be different due to drivetrain, friction, and aero losses. The part I am considering is the shape of the curve — the engine dyno showed that the LH2 makes a bit more power from 5500-6400 RPM. To be fair, it is not on the same up-slope as 1000-5500 RPM.
Today’s test added to the Tune 5 baseline. The Madtuner result is supportive that there is more to be gained here somewhere. The Madtuner experience closely mirrors my results and varies from the engine dyno. More testing to follow.
If you have ideas, suggestions, encouragement, or advice please hit Reply!
If you are not getting the results you expect, reset and try again. Today I moved to Tune 5, which is the OEM calibration with only changes to TUTD shift, top speed, and MAF calibration for the Volant. No AFR baseline changes, no stoich, no timing changes.
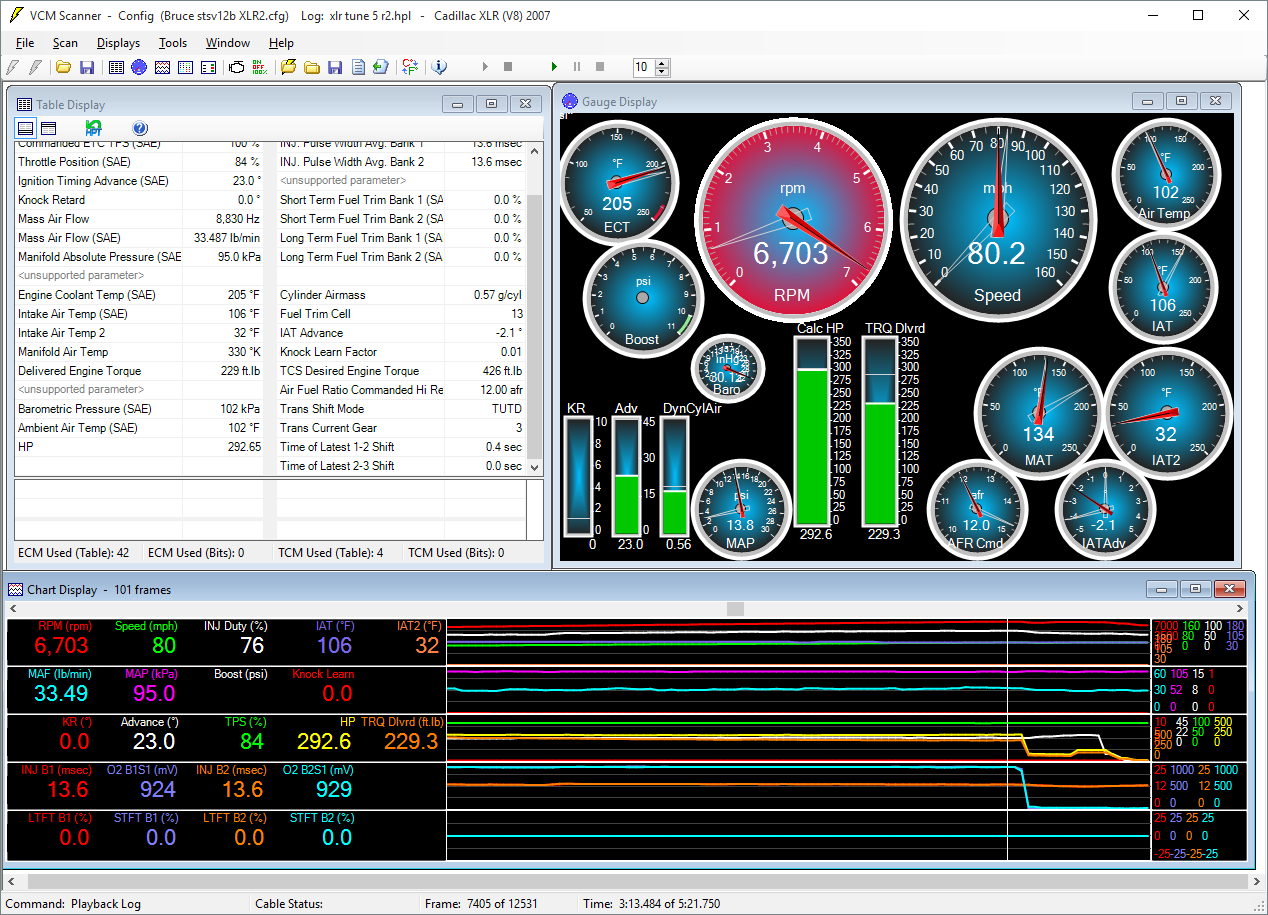
During the test run I was very disappointed to see the calculated HP only topped out at 200 hp or so. Then I realized the VCM scanner had crashed along the way due to some laptop or scanning glitch. I reset the scanner, and checked the cables and the hptuners interface. Then the XLR crashed – hard. Every system reported with beeping and dinging and flashing and attention getting displays that it was not happy. At that point the scanner would not connect to the car, the car was having a crisis, and I was quite concerned.
I share this with you so if you are ever busy testing this or that and everything goes to heck in a hand-basket, you know that’s a regular thing.
Eventually through some combination of resetting all the hardware including the XLR I was able to get the scanner to talk to the XLR, clear all DTCs, and properly scan for outputs again. Then I went back to testing.
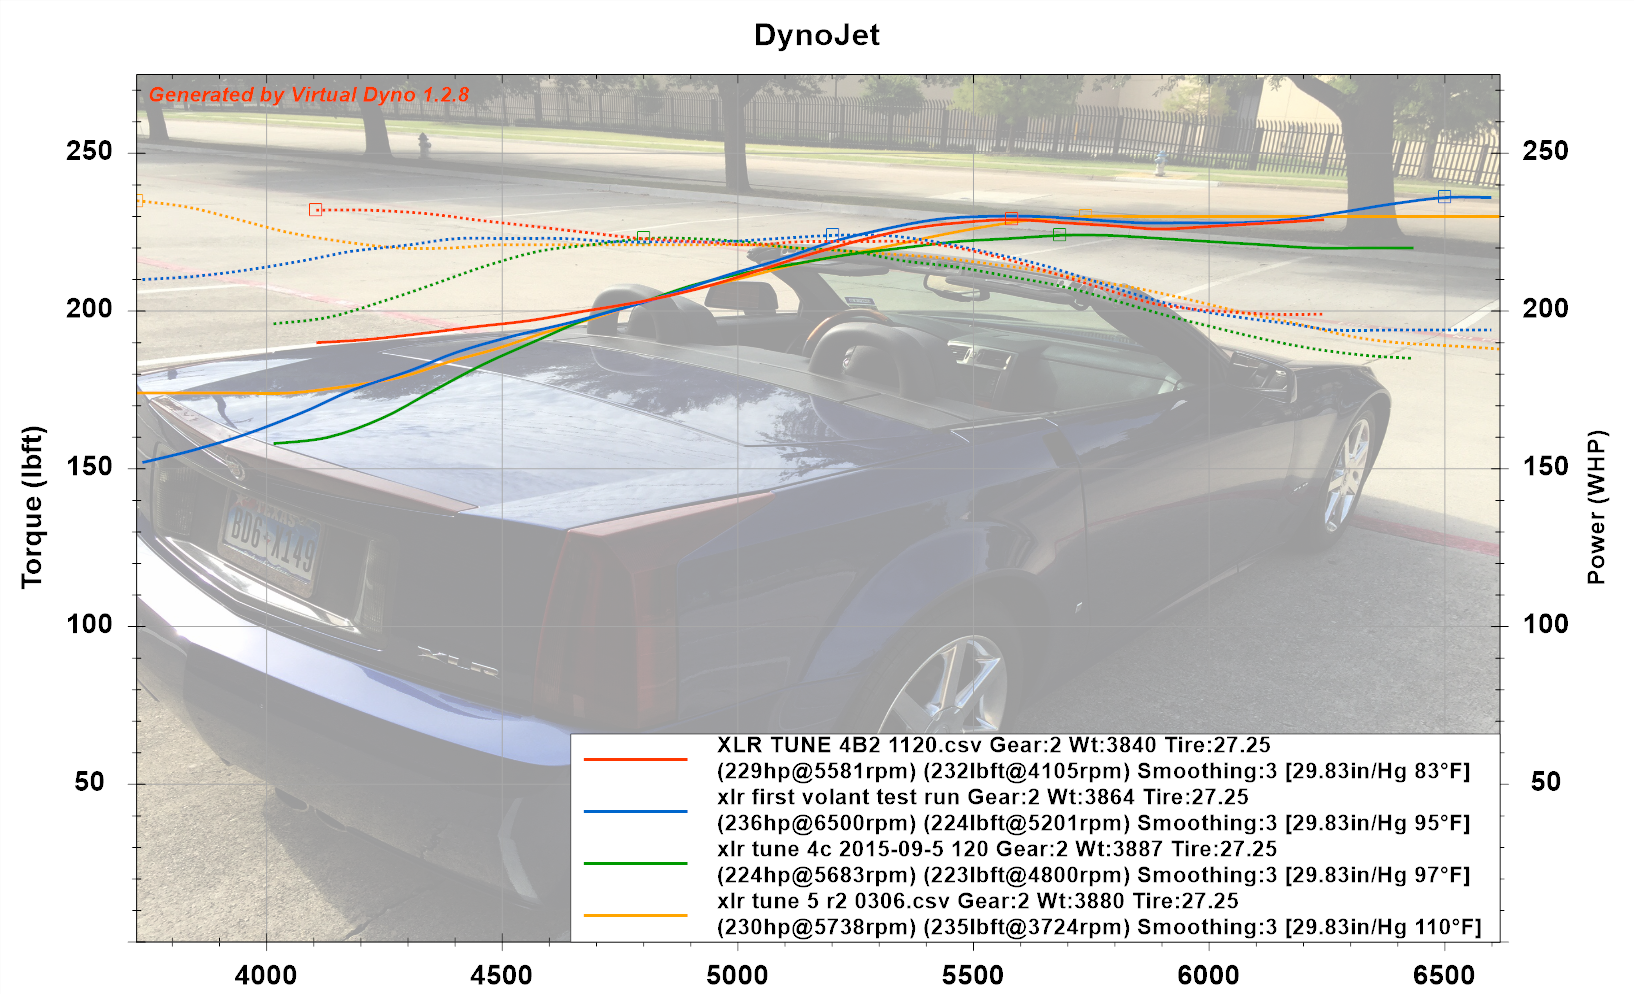
With the reset the Intake air temps were up to 113F to start the test, sliding down to 106F at test end. I don’t have a perfect way to model that so I used 110F as an average; (110F vs 106F is 1 hp delta at peak). ECT was 205F. Ambient air was 102F.
In this graph the Yellow/Gold line is today’s test. The Red and green lines are prior Tune 4 runs, and the Blue line is the first Volant test.
What I suspected was the PE changes were causing the slight dip between 5500-6000 and we see some improvement there in today’s run. The timing changes overall seem to help at lower RPM but don’t appear to be a disadvantage at high RPM.
The increase in TUTD shift speed to 82 did hold the shift til after/at 6700 RPM but there was some fuel cutout prior to shift, so I’ll move that down 1 mph to 81 mph. I could go back to default functionality of the TUTD which is not to shift automatically at all but for street driving I like the ability to use TUTD to select current gear but have the trans shift at redline.

This graph shows today’s Virtual Dyno test result alone.
Overall I am happy the testing glitch straightened out. I think pulling back the PE in Tune 5 to OEM helped. I am still not sure why we see an upward slope in some tests from 6000-6700 rpm and not in others. I was hoping that was just a test capture issue, but the test result looks flat from 5500-redline. Recall the AFR goes 0.5 richer for piston protection at 6000 RPM, so that may have an effect, or simply the hot air and timing that is pulled in that region for IAT and ECT, or (not sure).
Next is more baseline testing with Tune 5, or 5B with the slight mph change.
Thanks for reading along; if you have suggestions or wisdom to share please reply below.