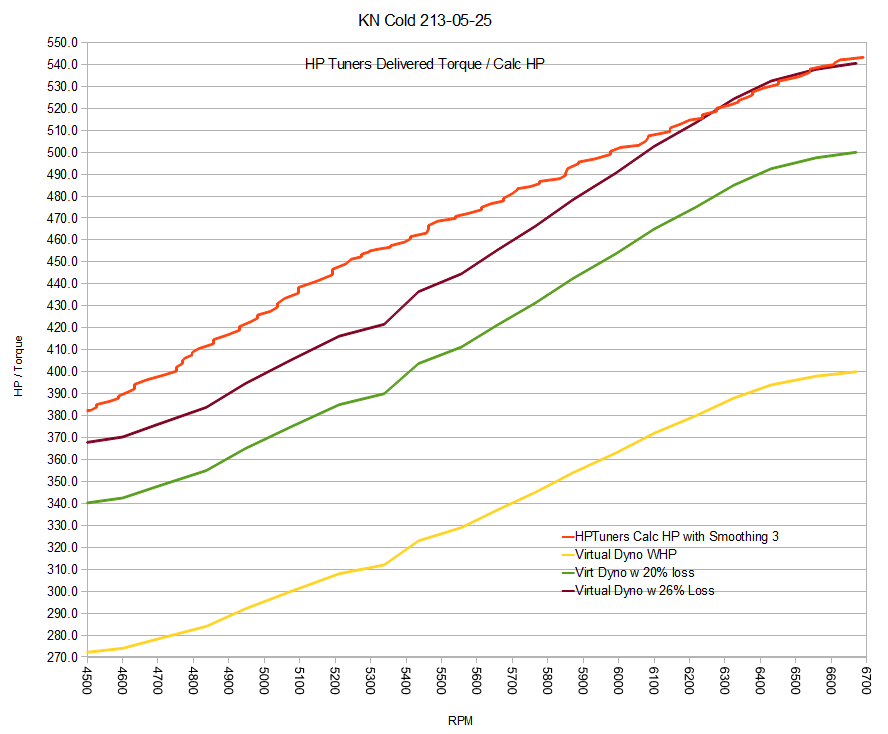
My Cadillac STS-V as most modern cars keeps up with how much torque the powertrain is delivering. It uses this info to make adjustments in power delivery if needed.
Knowing the Delivered Torque, we can derive the Calculated HP, since we know the standard definition HP = (Torque x RPM)/5252
| Engine RPM (SAE) rpm | Delivered Engine Torque ft.lb | Calc Engine HP |
| 3564 | 423 | 287.05 |
Virtual Dyno focuses on lovely HP/Torque graphs of power at the wheels, but of course is based on data tables which one can read from the graph node points.
| Virtual Dyno WHP | |
| RPM | WHP |
| 4489 | 272 |
| 4600 | 274 |
| 4693 | 278 |
| 4836 | 284 |
How do the Virtual Dyno wheel hp values relate to the engine’s calculated hp values for the same data run?
The Red line in this chart is the HPTuners Calculated HP. I have applied smoothing 3, which is to say I have averaged the 3 prior and 3 following values at each point in order to smooth the graph. The Yellow line is the Virtual Dyno wheel HP values for the exact same test run.
These two measure different things — the calculated hp is power at the crank; the Virtual Dyno is hp at the wheels. We might expect them to differ by a standard dyno adjustment for transmission losses for automatic transmission vehicles, or 20%. The Green line is the Virtual Dyno adjusted upwards to account for 20% transmission losses. Still not on top of the engine hp line.
The adjustment needed in this case is around 26%, which is the purple line (between the green and the red lines). At high RPM this line overlays almost perfectly with the calculate engine HP line, and is closer at very low RPM, although not at mid-range values.
There are multiple sources of error and adjustment variables among these lines.
- The engine uses a model to determine what makes engine power, which may or may not directly relate to more power at the wheels. I suspect it does relate closely to more power at the crank.
- My test area is at 635 feet elevation, which is a 3% adder due to air density
- In Dynojet mode, Virtual Dyno adds 9% to emulate a Dynojet result — as a side note, I enjoyed this story on Dynojet development
- Virtual Dyno uses car weight, driver weight, and weather entries. If I am off on my entry it would effect the calculation.
- Virtual Dyno is adjusting to SAE standard
- It also uses vehicle coefficient of drag, and frontal area to adjust for wind resistance. If I am off on these entries, or have a head-wind or tail wind, it would effect the calculation.
Now all these are normal issues to be dealt with, but the amazing thing I suppose is that it works at all — that we get meaningful data to gauge by. My purpose for exploring these issues in this article was to get a handle on how the Virtual Dyno result differed from the Delivered Torque.
A short summary might be the STS-V has transmission losses of 22-24% and I am at the equivalent of 3% elevation, so 25-27% losses and that is what we see in the data. However, one purpose of the thumbrule of average transmission losses for an automatic of 20% and manual of 15% is to be able to compare dissimilar cars — and how much WHP the car is putting down is what matters for how the car moves. So the long and the short of it is, the car is putting around 400 whp and this car may have to make 540+ hp to do that, but an ‘average’ competitor will be able to do that with 500 hp.
I tend to use both to gauge mods — if the delivered torque / hp go up, that’s good, and I confirm the same trend in Virtual Dyno to determine the benefit of a mod.
What do you think? Any advice on how to remove any variables or better use the tools?


Pingback: HPTuners, Delivered torque, Virtual Dyno, SC losses | CaddyInfo – Cadillac Conversations Blog